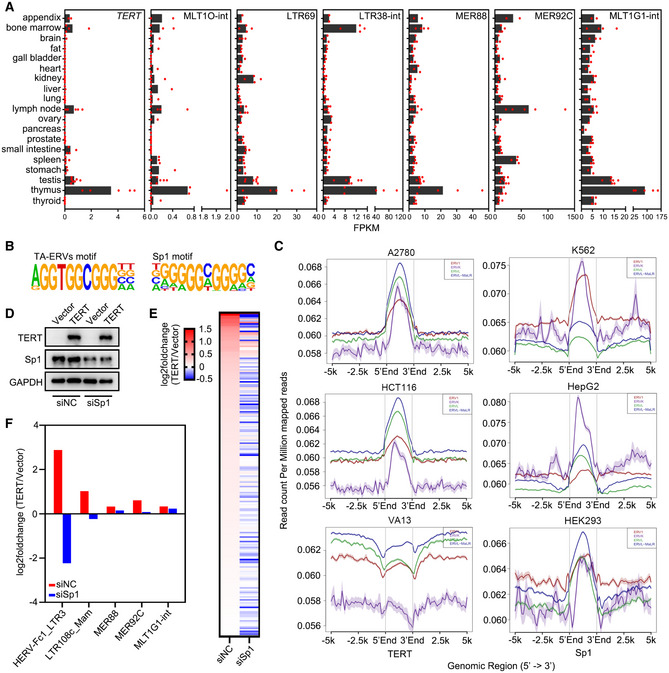
Figure EV2. TERT activates ERVs via interaction with Sp1.

-
AExpression of TERT and ERVs in human tissues using RNA‐seq data from the GEO database. Data represent average expression levels of TERT and ERVs. Appendix, n = 2. Bone marrow, n = 4. Brain, n = 3. Fat, n = 3. Gall bladder, n = 3. Heart, n = 3. Kidney, n = 4. Liver, n = 3. Lung, n = 4. Lymph node, n = 5. Ovary, n = 2. Pancreas, n = 2. Prostate, n = 4. Small intestine, n = 4. Spleen, n = 4. Stomach, n = 3. Testis, n = 7. Thymus, n = 5. Thyroid, n = 4.
-
BMotif analysis using the sequences of representative TA‐ERVs.
-
CChIP‐seq analysis for TERT and Sp1 from the GEO database. Average binding profiles of TERT on ERV1, ERVK, ERVL, and ERVL‐MaLR in A2780 and HCT116 cells, VA13 cells as the negative control (left); and Sp1 binding profiles in K562, HepG2, and HEK293 cells (right).
-
D–FWestern blot analysis of TERT and Sp1 expression (D), log2 fold change of ERVs plotted as heat map (E), and log2 fold change of representative ERVs (F) in siNC or siSp1 transfected U2OS cells expressing TERT versus control vector.
Source data are available online for this figure.
