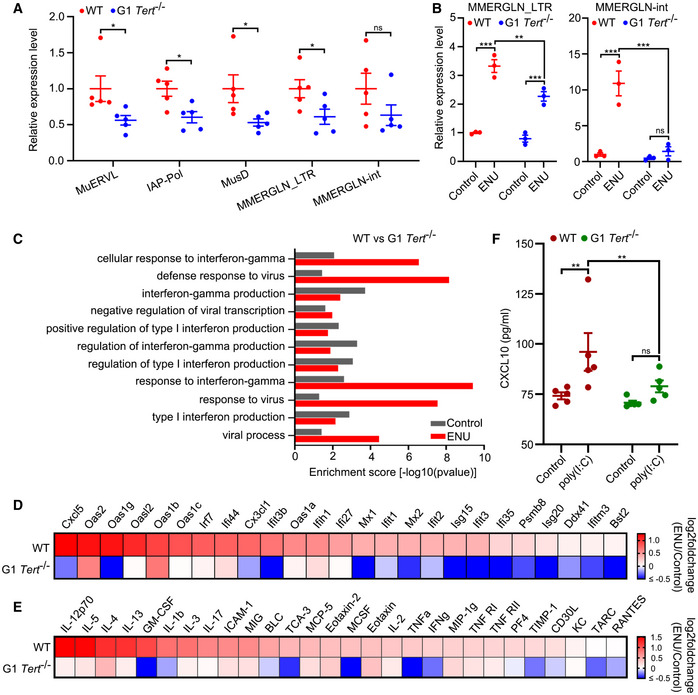
Figure 4. Deletion of Tert leads to decreased ERV expression and compromised interferon response in mice.

-
AExpression of murine ERVs in blood of WT and G1 Tert −/− mice. n = 5 mice per group.
-
BExpression of MMERGLN_LTR and MMERGLN‐int in livers of WT and G1 Tert −/− mice treated with ENU or saline (control). n = 3 mice per group.
-
CEnriched biological processes (BP) for WT versus G1 Tert −/− mice. GO was analysed for upregulated genes in WT mice compared to G1 Tert −/− mice under control or ENU treatment.
-
DHeat map showing log2 fold change differences of interferon‐related genes expression between ENU treatment and control (saline) in WT and G1 Tert −/− mice by RNA‐seq. n = 3 mice per group.
-
EHeat map showing log2 fold change differences of cytokine/chemokine between ENU treatment and control (saline) in WT and G1 Tert −/− mice by cytokine/chemokine array. n = 5 mice per group.
-
FELISA of CXCL10 in WT and G1 Tert −/− mice treated with poly(I:C) or saline (control). n = 5 mice per group.
Data information: Data represent mean ± SEM (A, B and F). *P < 0.05, **P < 0.01, ***P < 0.001, ns, not significant. Unpaired two‐tailed Student’s t‐tests were used for A, and two‐way ANOVA with Fisher's LSD tests was used for (B) and (F).
