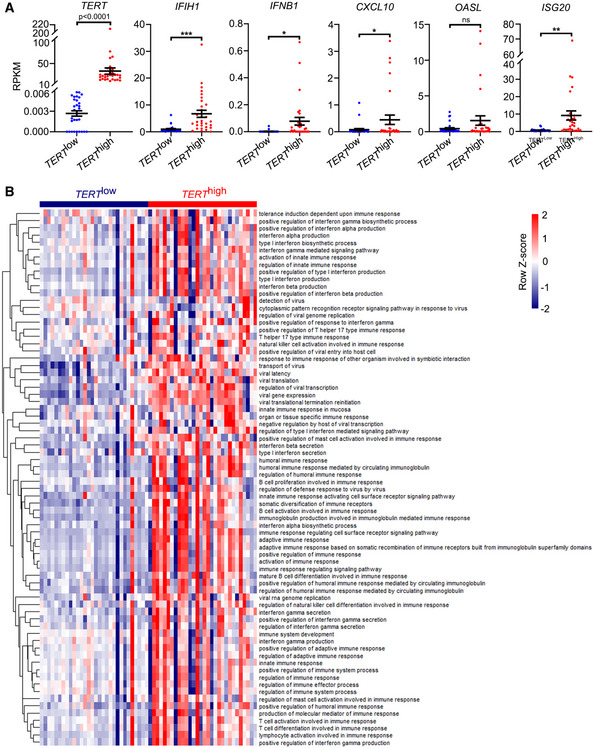
Figure EV4. Analysis of gene expression and ssGSEA in the Cancer Cell Line Encyclopaedia (CCLE).

-
ACCLE reads per kilobase million (RPKM) values of TERT, IFIH1, IFNB1, CXCL10, ISG20, and OASL in cancer cell lines grouped in TERT high and TERT low groups (n = 30 each). Data represent mean ± SEM. *P < 0.05, **P < 0.01, ***P < 0.001, ns, not significant, using unpaired two‐tailed Student’s t test.
-
BssGSEA of GO terms related to interferon response in TERT high and TERT low cancer cell lines (n = 30, respectively) across CCLE.
