-
A
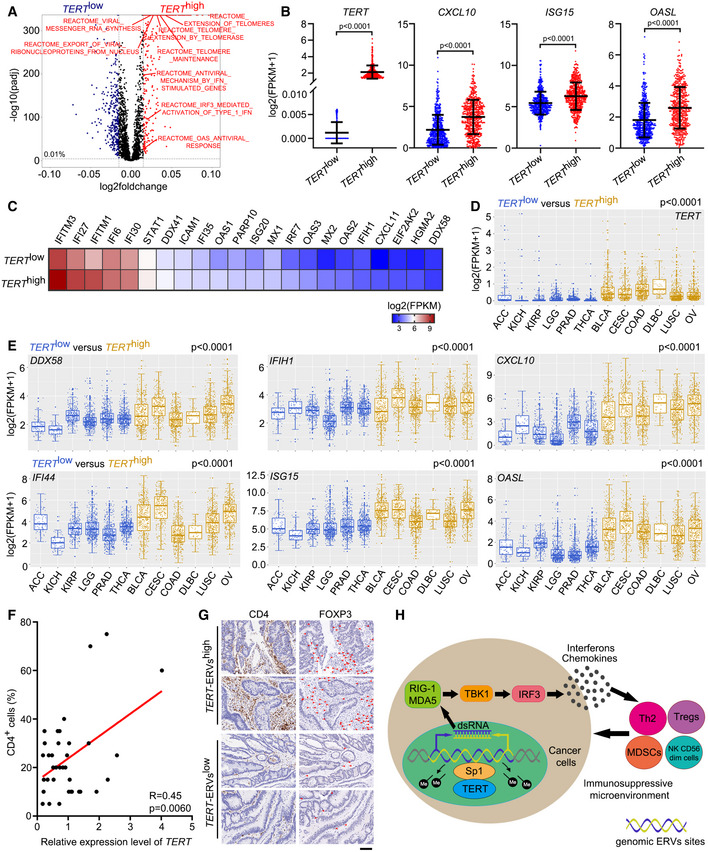
Scatterplot representing differences in ssGSEA of cellular pathways in TERT
high versus TERT
low tumours (n = 4,632 tumours in each group) across TCGA.
-
B
TCGA fragments per kilobase million (FPKM) values of TERT, CXCL10, ISG15, and OASL in tumours grouped in TERT
high (n = 500) and TERT
low (n = 500) groups. Data represent mean ± SD. P‐values were analysed using unpaired two‐tailed Student’s t‐tests.
-
C
TCGA FPKM values of interferon‐related genes in tumours grouped in TERT
high (n = 500) and TERT
low (n = 500) groups. Heat map showing mean FPKM values of each gene.
-
D, E
Expression of TERT (D) and DDX58, IFIH1, CXCL10, IFI44, ISG15, and OASL (E) in TERT
high and TERT
low cancer types (6 types in each). ACC (adrenocortical carcinoma), n = 79. KICH (kidney chromophobe), n = 66. KIRP (kidney renal papillary cell carcinoma), n = 291. LGG (brain lower grade glioma), n = 532. PRAD, n = 502. THCA, n = 513. BLCA (bladder urothelial carcinoma), n = 414. CESC (cervical squamous cell carcinoma and endocervical adenocarcinoma), n = 306. DLBC (lymphoid neoplasm diffuse large B‐cell lymphoma), n = 48. LUSC (lung squamous cell carcinoma), n = 502. OV (ovarian serous cystadenocarcinoma), n = 430. All boxplots include the median line, box indicates the interquartile range (IQR) and whiskers denote the 1.5 × IQR. P‐values were analysed using two‐tailed Mann–Whitney U test.
-
F
Regression analysis of the correlation between TERT expression and percentage of CD4+ cells in colon tumours. n = 36.
-
G
Representative sections of immunohistochemical staining of CD4 and FOXP3 in TERT‐ERVshigh and TERT‐ERVslow colon tumours. Red arrowheads indicate FOXP3+ cells. Scale bar = 100 μm.
-
H
Schematic model showing TERT contributing to immunosuppressive tumour microenvironment by activating ERVs.

