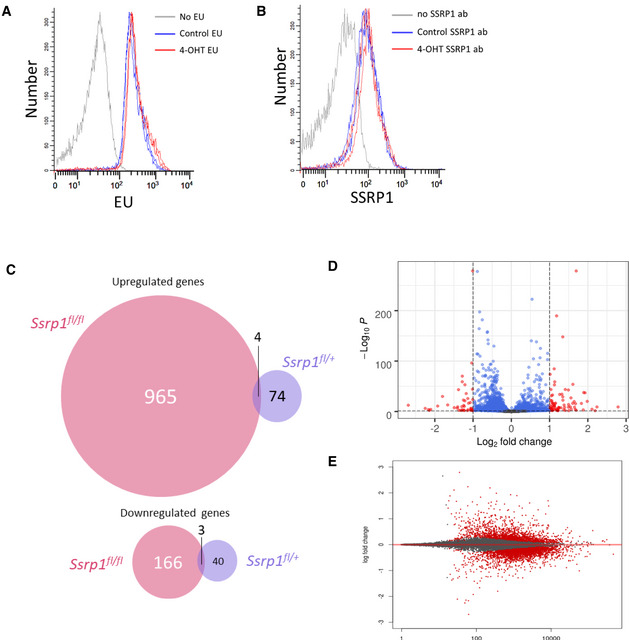
Figure EV4. Comparison of changes in transcription in MSC of two genotypes treated with vehicle of 4‐OHT for 5 days and then split and analyzed 24 h after.

-
A, BEU incorporation assay (30 min) (A) and staining with SSRP1 antibody (B) of Ssrp1fl /+; CreERT2 +/+ MSC. Two replicates are shown.
-
C–EData of RNA‐seq experiment with two replicates of MSC. C. Venn diagrams showing number of up‐ and downregulated genes in homo‐ and heterozygous cells. D. Volcano plot of gene expression changes in heterozygous cells upon 4‐OHT treatment. E. MA plot of gene expression changes in heterozygous cells upon 4‐OHT treatment.
