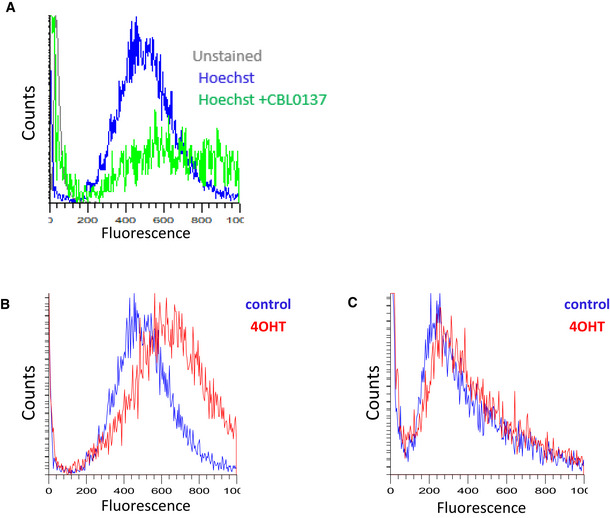
Figure EV5. Assessment of general chromatin accessibility by staining DNA in live cells with Hoechst 33342. Histograms of fluorescent intensity of MSC stained with 3 µM of Hoechst 33342 for 15 min.

- After incubation with CBL0137 (1 µM) for 30 min. This plot also includes overlap of histogram of negative control (cells unstained with Hoechst).
- Ssrp1fl / fl ; CreERT2 +/+ cells untreated or treated with 4OHT.
- Ssrp1fl /+; CreERT2 +/− cells untreated or treated with 4OHT.
