
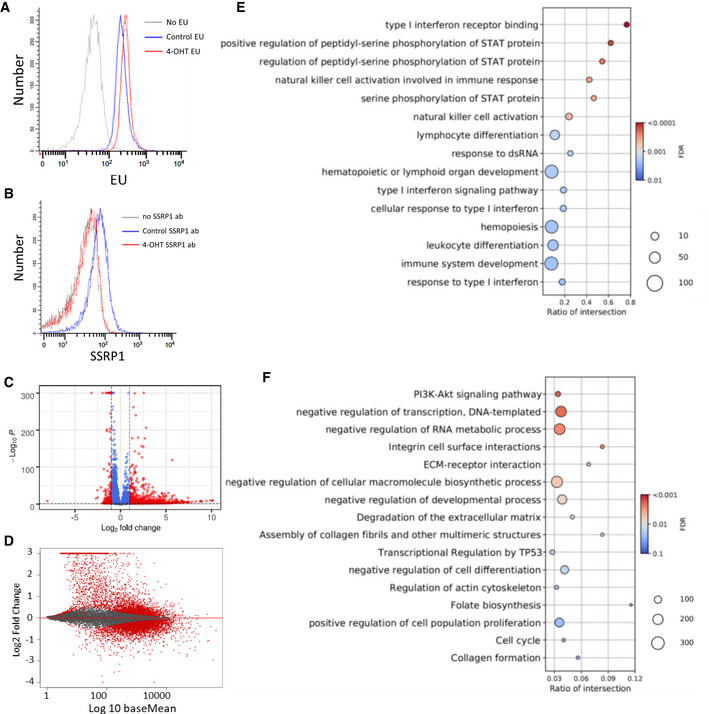
Figure 7. Comparison of transcription between Ssrp1fl / fl ; CreERT2 +/+ MSCs treated with vehicle or 4‐OHT.
-
AEU incorporation measured by flow cytometry. Histograms of EU fluorescent signals from two biological replicates for each condition (except no EU).
-
BSSRP1 staining of the cells in A.
-
CVolcano plot of changes in transcript counts in 4‐OHT‐treated cells versus control. Red dots indicate transcripts with fold‐change ≥ 2 and FDR < 0.05. n = 2 biological replicates.
-
DMA plot showing the difference between the changes in transcript counts in 4‐OHT‐treated MSCs vs. control and the average expression of the same transcripts between conditions (baseMean). n = 2 cell cultures.
-
E, FDot plots with the results of GO enrichment for genes upregulated (C) and downregulated (D) upon FACT depletion.