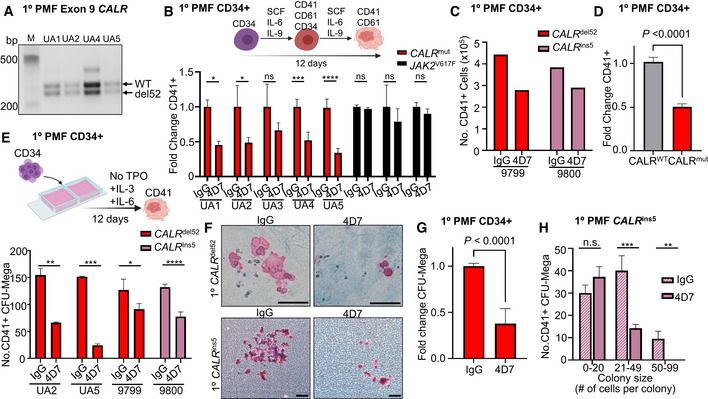
Figure 3. 4D7 monoclonal antibody specifically inhibits primary megakaryocyte differentiation of mutated CALR myelofibrosis samples.

- PCR amplification of CALR exon 9 from patients confirming heterozygous del52 mutation in sorted CD34+ cells obtained from CALR‐mutated myelofibrosis samples.
- Graph showing the decreased fold change of CD41+CD61+ megakaryocytes cultured in 4D7 compared to IgG. FACS‐sorted CD34+ from myelofibrosis patients with CALR or JAK2 mutation was cultured over 12 days without TPO in the presence of SCF, IL‐6 and IL‐9. Black columns show JAK2 V617F mutation‐positive samples (n = 4 technical replicates of samples from different patients).
- Number of CD41+ megakaryocytes derived from isolated CD34+ progenitors from myelofibrosis patients. Number of CD41/CD61+ cells counted on day 12 using trypan blue exclusion (n = 1 technical replicate).
- Summary of fold change reduction of CD41/CD61+ megakaryocytes by 4D7 in all tested CALR‐mutated patient samples compared to CALR wild type, normalized to IgG (n = 11 samples from different patients, with four technical replicates per sample).
- Number of CD41+ megakaryocyte colonies from patient samples after 4D7 treatment. CD34+ from patients with myelofibrosis with CALR del52 or CALR ins5 was plated on collagen‐based matrix in presence of 20 µg/ml 4D7 or IgG control (n = 3 biological replicates).
- Representative micrographs showing CD41+ colonies in pink and CD41‐ colonies in blue after treatment with 4D7 or IgG at 100× or 40× magnification. Scale bar indicates 100 µm.
- Summary of fold change reduction in CD41+ megakaryocytes in CALR‐mutated samples cultured MegaCult treated with 4D7 compared to IgG (n = 4 biological replicates).
- Number of megakaryocyte colony forming units grouped according to colony cell number after 4D7 treatment in a mutant CALR ins5 sample (n = 3 biological replicates).
Data information: Bars represent standard error of means in (D) and (G). Unpaired Student's t‐test used to determine statistical significance in (B, D, E, G and H). Bars represent standard deviations in (B, E and H). *P = 0.05–0.01, **P = 0.01–0.001, ***P = 0.001–0.0001, ****P < 0.0001, n.s, not significant.
