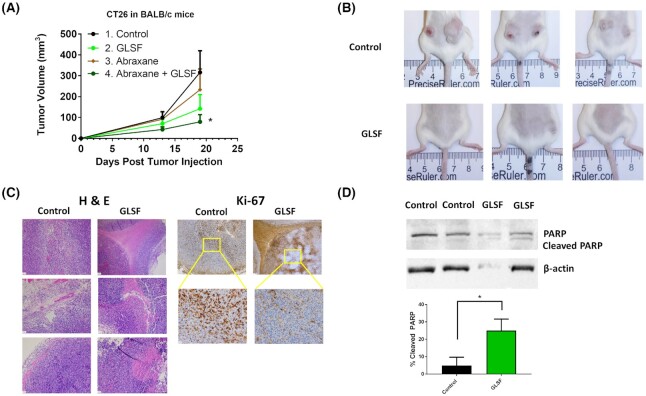
Figure 4.
Effects of GLSF on tumor growth and apoptosis in a colorectal cancer syngeneic model. (A) The CT26 cells were subcutaneously implanted into the female BALB/c mice after the mice were fed with the control diet (groups 1 and 3) or diet containing GLSF (groups 2 and 4) for 4 weeks. Groups 3 and 4 mice were treated with a single dose of abraxane® on Day 13. Tumor volumes were measured on Days 13 and 19 (Day 0 was the day of tumor injection). *: P < 0.05 by Tukey-Kramer Multiple-Comparison test (n = 8 for G1 and G2; n = 4 for G3 and G4). (B) Representative photos of mice in control and GLSF groups. (C) Tumor tissues were stained with H&E or immunohistochemical staining of Ki-67. (D) Western blot analysis of PARP, cleaved PARP, and β-actin. Representative gel images are shown. Bar graphs represent the ratios of cleaved PARP/total PARP. *: P < 0.05 as compared with the control group by t test. PARP, poly (ADP-ribose) polymerase. Control n = 5 tumors, GLSF n = 4 tumors.

