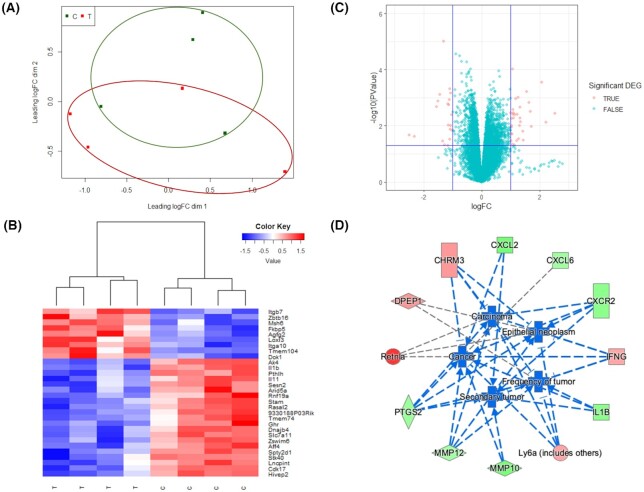
Figure 5.
RNA-seq analysis of CT26 syngeneic tumors in mice treated with control diet or GLSF-modified diet. (a) Multi-dimensional scaling plot of detected genes in GLSF treatment (T, red) and control group (C, green). The distances correspond to leading log2 fold-changes between each pair of samples. (b) Volcano plots of differentially expressed genes between treatment and control groups. The red dots indicate up- and down-regulated DEGs with P < 0.05 and absolute log2 FC > 1. (c) Heat map of top 30 significantly differentially expressed genes between treatment (T) and control groups (C). (d) Genes that are up- and down-regulated in treatment group (compared to control) are displayed within red or green nodes, respectively. The predicted inhibited biology effects are presented in blue nodes. Blue (predicted to be inhibited) or gray (undetermined direction) dash lines represent relationships with causal consistency.

