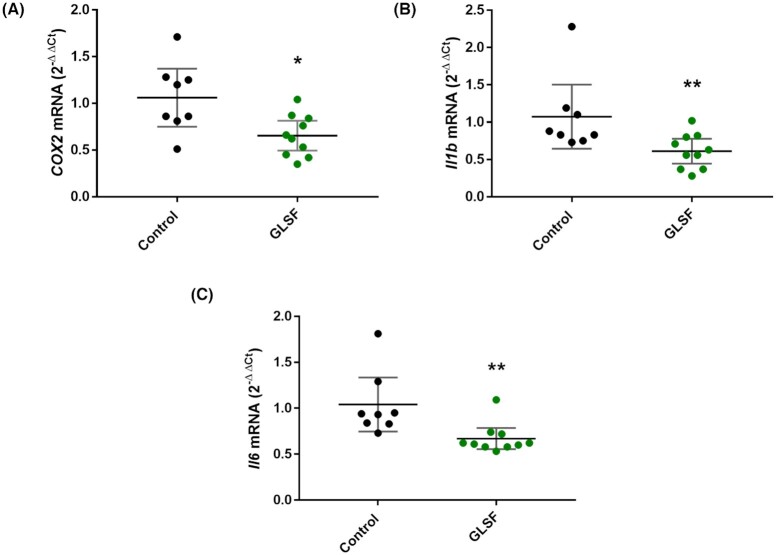
Figure 6.
qRT-PCR results from tumor samples of control or GLSF groups for (A) COX-2, (B) IL-1β, and (C) IL-6. β-actin was used as normalization control and data are expressed as mean with 95% CI. n = 8 tumor samples from control group. n = 10 tumor samples for GLSF. *: P < 0.05; **: P < 0.01 via a Mann-Whitney U approximation without correction for normality.

