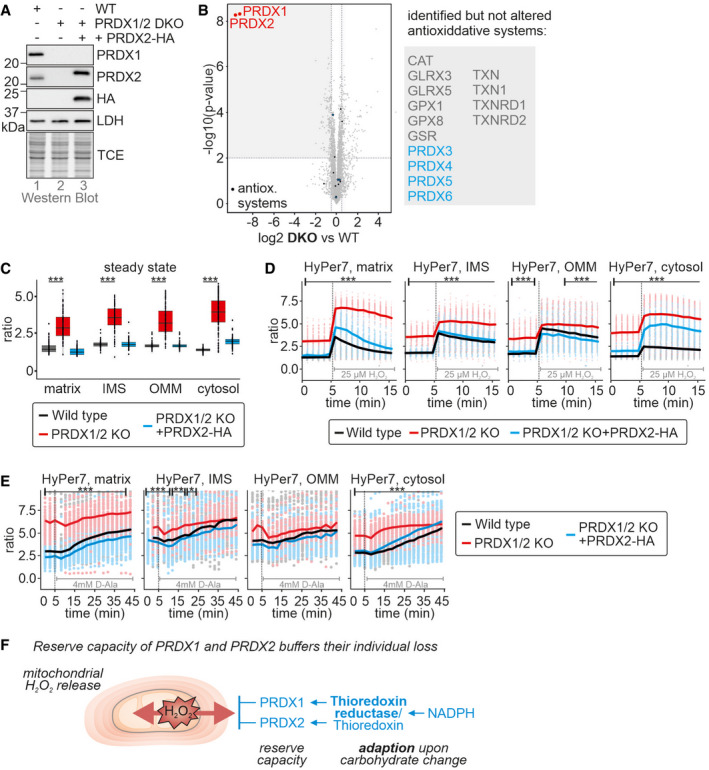
Figure 8. Peroxiredoxin 1 and 2 double knockout cells are strongly impaired in handling of mitochondrial H2O2 release.

-
A, BPeroxiredoxin levels in peroxiredoxin 1 and 2 double knockout cells (PRDX1/2 DKO). Lysates of the indicated cell lines grown in glucose‐containing medium were analyzed by immunoblot (A) and quantitative proteomics (B). The right subpanel in (B) lists all detected but not altered proteins belonging to cellular antioxidative systems.
-
CHyPer7 steady state ratios of the indicated cell lines. HyPer7 probes were targeted to the indicated compartments of the respective cell lines. The cells were grown in glucose‐containing medium. The numbers of cells per experiment for each dataset can be found in Appendix Table S6. In the boxplot, the central band is the median. The lower and upper hinges correspond to the first and third quartiles. The upper whisker extends from the hinge to the largest value no further than 1.5 times the inter‐quartile range, whereas the lower whisker extends from the hinge to the smallest value no further than 1.5 times the inter‐quartile range
-
DResponse of HyPer7 probes targeted to indicated compartments to treatment with 25 µM of exogenous H2O2. Indicated cell lines (black, wild type; red, PRDX1/2 DKO) were grown in glucose‐containing medium. Solid line represents average, points colored in the lighter version of the respective color are the corresponding ratios measured in individual cells.
-
EResponse of HyPer7 probes targeted to indicated compartments to treatment of mtDAO‐expressing cell lines with 4 mM of D‐Ala (black, wild type; red, PRDX1/2 DKO; cell generated with the piggyBAC system). The cells were grown in glucose‐containing medium. Solid line represents average, points colored in the lighter version of the respective color are the corresponding ratios measured in individual cells.
-
FModel. See discussion for details.
Data information: The numbers of cells per experiment for each dataset can be found in Appendix Table S6. Statistical analysis was only performed to compare the PRDX1/2 DKO with the wild type. As most of the data were not normal distributed, instead of a t‐test, a Wilcoxon/Mann–Whitney‐U‐test was performed and samples were compared in pairs. *P ≤ 0.05, **P ≤ 0.01, ***P ≤ 0.001.
Source data are available online for this figure.
