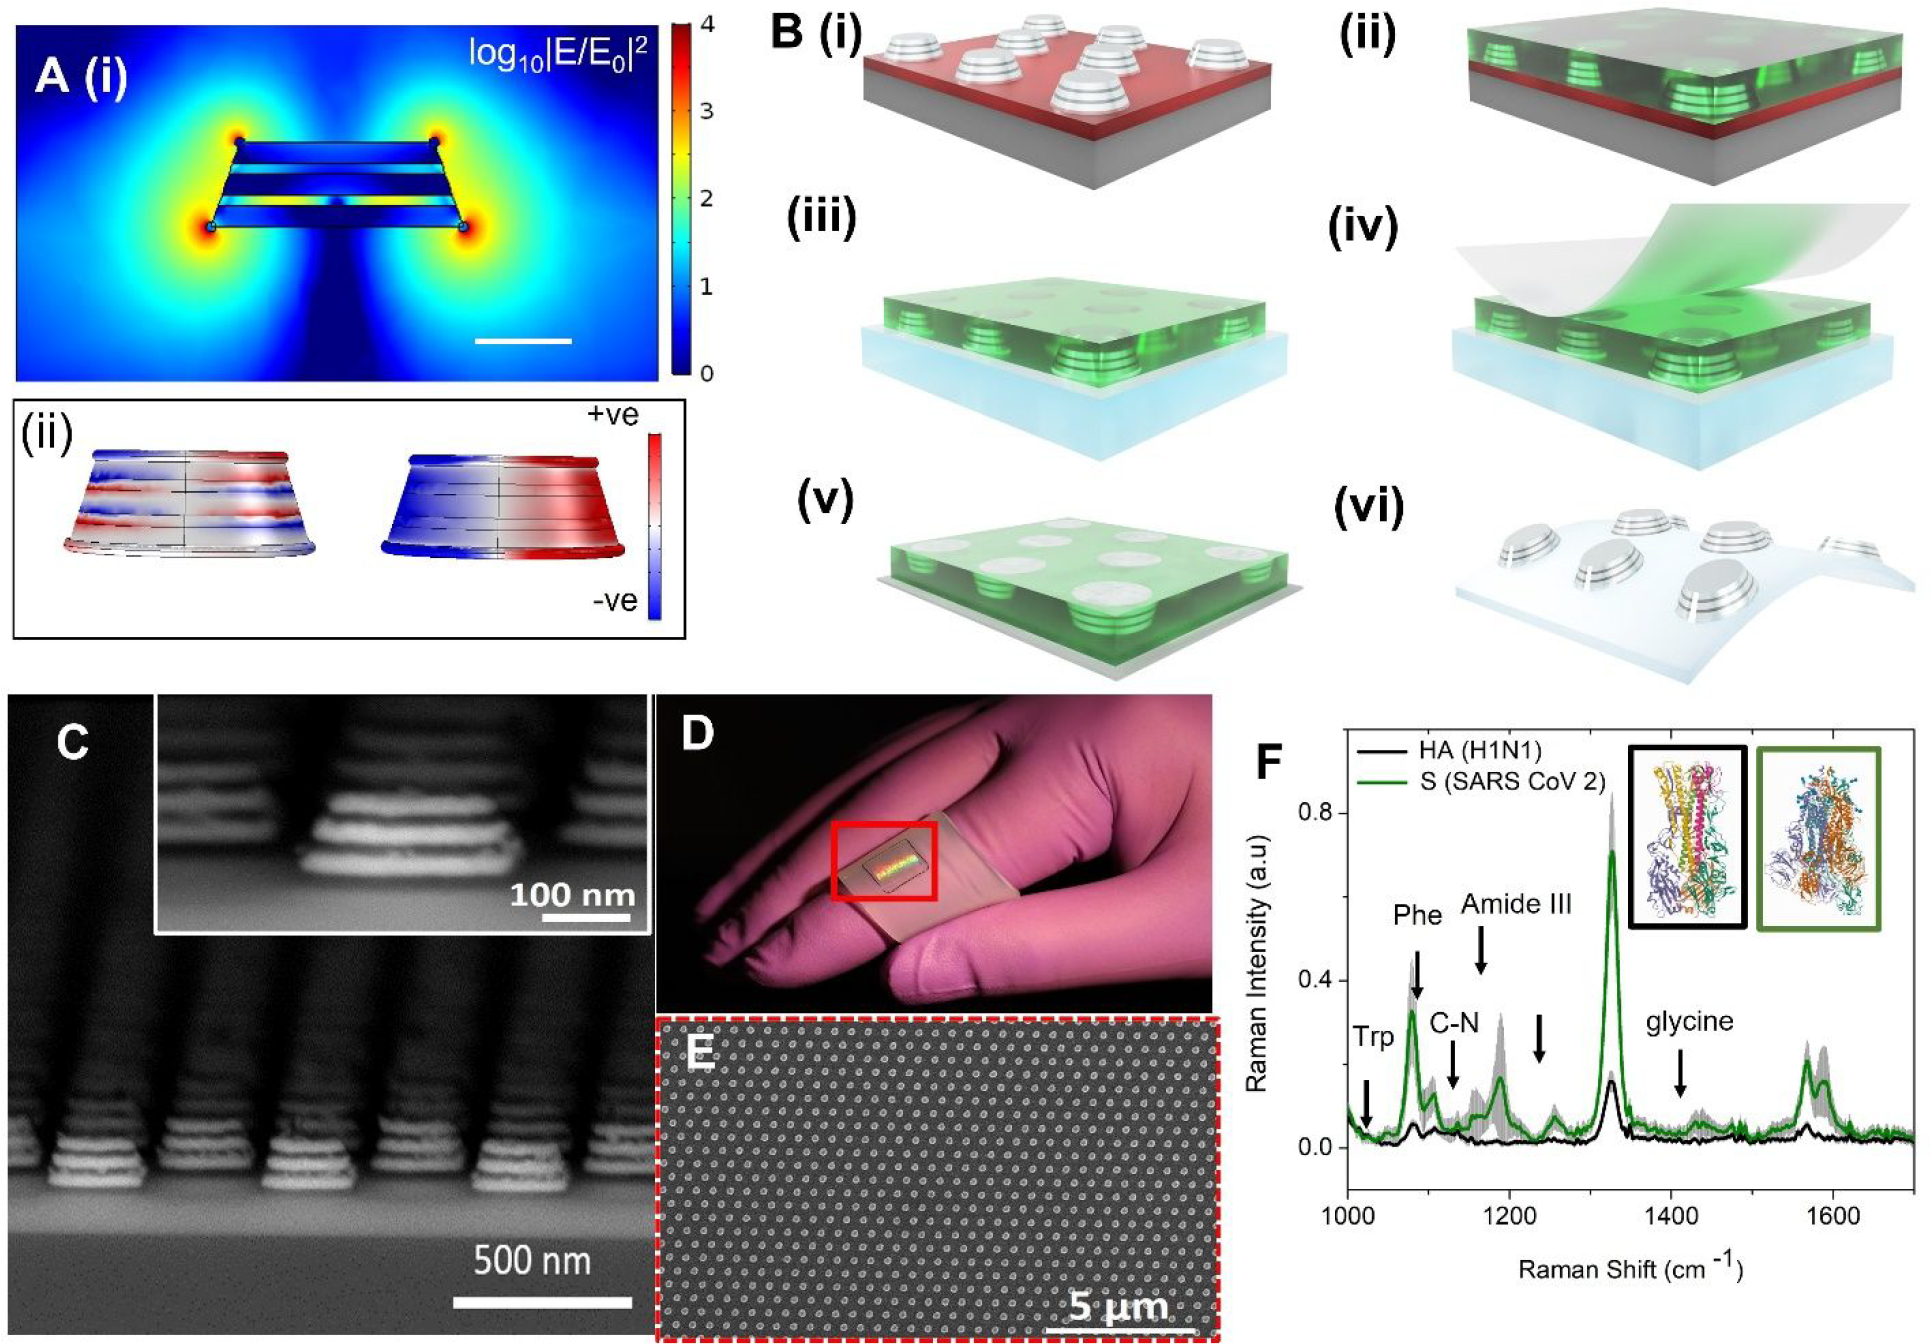
Figure 2: Overview of the sensor substrate fabrication and detection of antigen.

(A) (i) Plot of the electric field enhancement of a simulated 5-layer FEMIA nanostructure (at 780 nm; near to the laser frequency used in the experiment) shows increased near field at the corners and the side wall. Scale bar 100 nm. (ii) Surface charge distribution of the nanostructure at two resonance peaks (590 nm and 760 nm). (B) Schematic of process steps for transfer of the field-enhancing metal-insulator antenna (FEMIA) on a flexible elastomer substrate. (C) SEM cross section view of a 5-layer FEMIA; the inset shows an enlarged view of a single nanostructure. (D) Transferred pattern on the elastomer substrate. The red bounding box marks the region with the pattern. (E) SEM image of the top view of the 5-layer FEMIA on an elastomer. (F) Raman spectra of 500 nM spike protein (S) and hemagglutinin protein (HA) found on the surface of SARS-CoV-2 and influenza H1N1 virus, respectively. The prominent peaks are marked in the figure. The inset shows the structures for HA (black box; PDB ID: 1RU7) (18) and S protein (green box; PDB ID: 6VSB) (19). Trp and Phe refer to tryptophan and phenylalanine. Grey shaded region represents the standard deviation.
