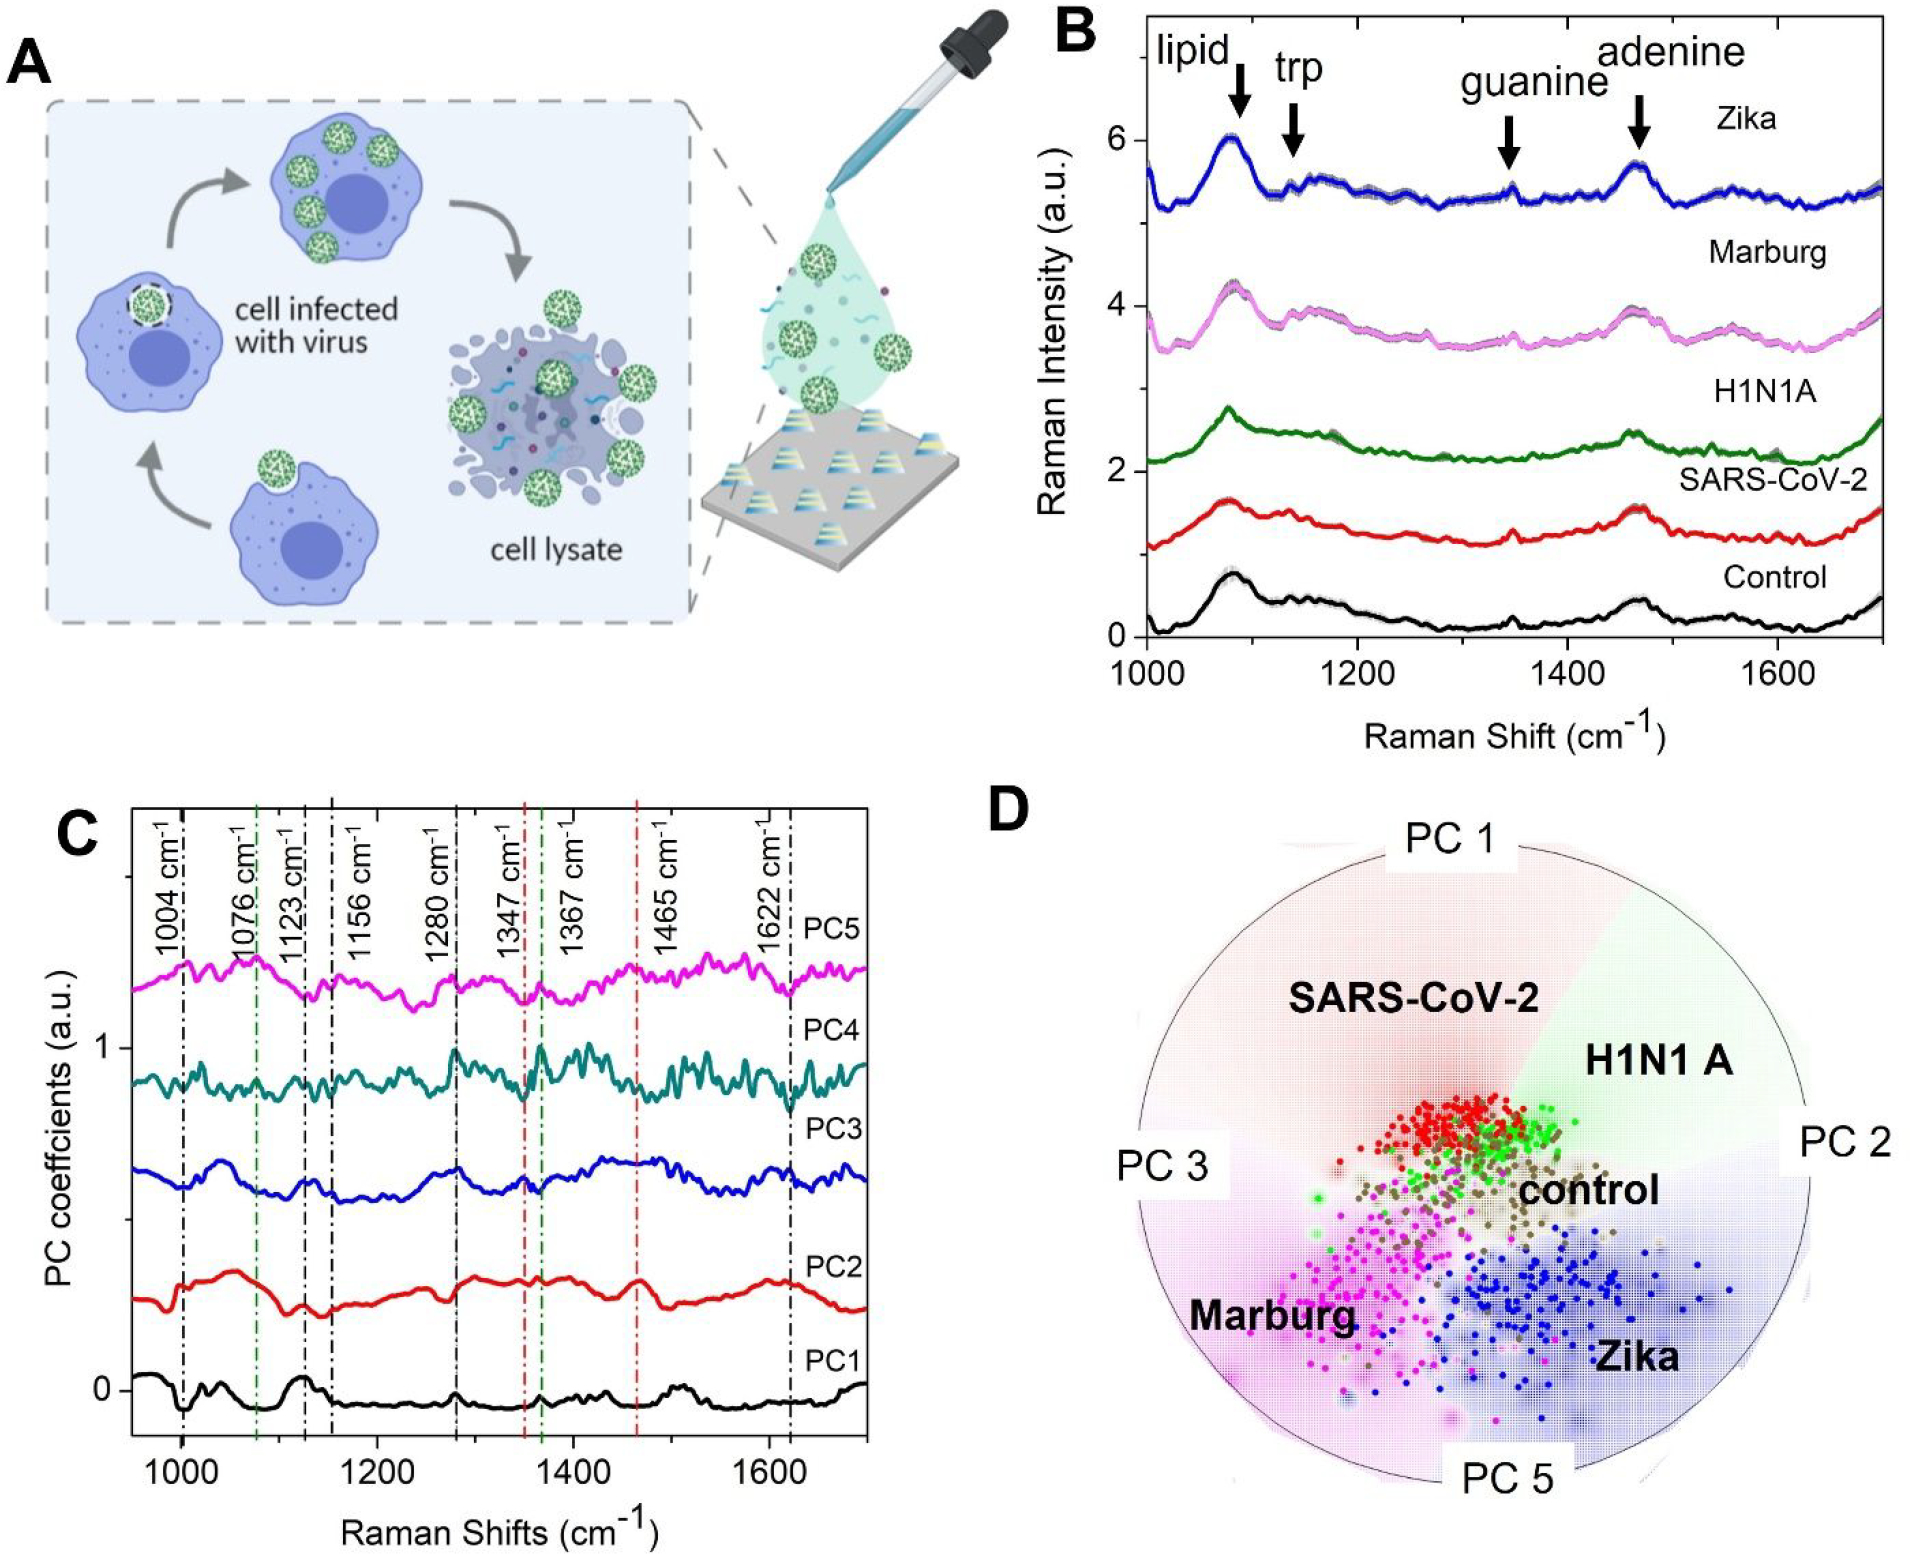
Figure 3: Virus detection on the SERS substrate using unsupervised machine learning.

(A) Schematic of the sample details and measurement scheme. Cell lysates infected with the virus are dropped on the FEMIA substrate and allowed to dry. (B) Raman spectra of the cell lysates containing different RNA viruses. The control sample is composed of uninfected cell lysate. Shaded regions represent the standard deviation. The spectra are vertically offset for easier visualization. (C) PC loadings plot of the entire data set consisting of spectra from the four different viral samples and control. The prominent features are marked with a dotted line- black, green, and red lines indicate the protein, lipid, and nucleic acid peaks (D) Radial visualization plot of the PC scores showing data from different samples cluster together. Each dot corresponds to a SERS spectrum.
