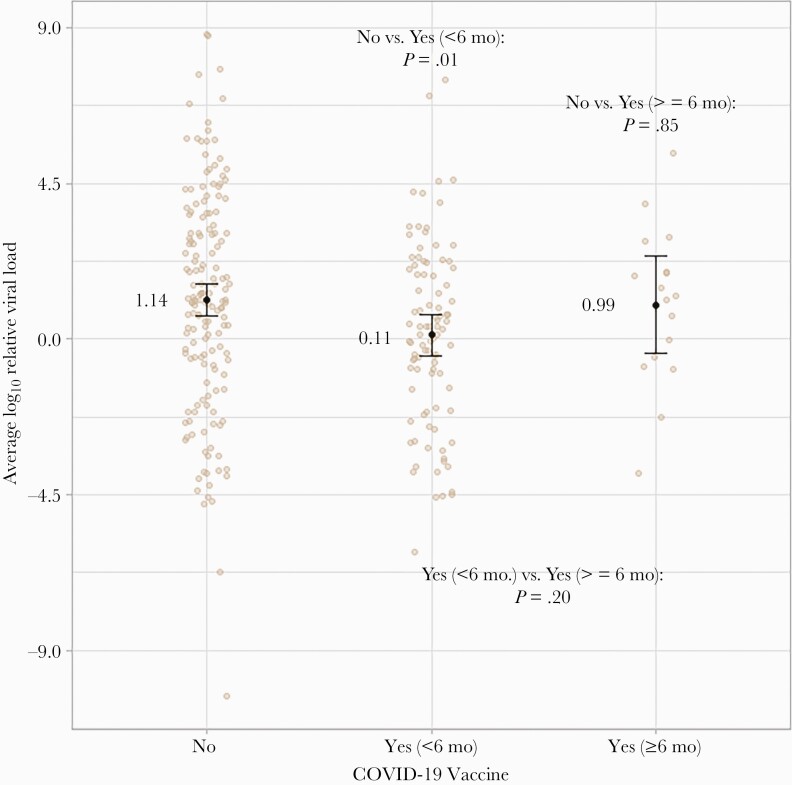
Figure 5.
SARS-CoV-2 log10 viral load values by COVID-19 vaccination status and duration of antecedent vaccination. The beige dots reflect each observation in the study sample, whereas error bars reflect average log10 viral load values and associated 95% confidence intervals. Random jittering was applied along the horizontal axis for visual clarity. Abbreviations: COVID-19, coronavirus disease 2019; SARS-CoV-2, severe acute respiratory syndrome coronavirus 2.

