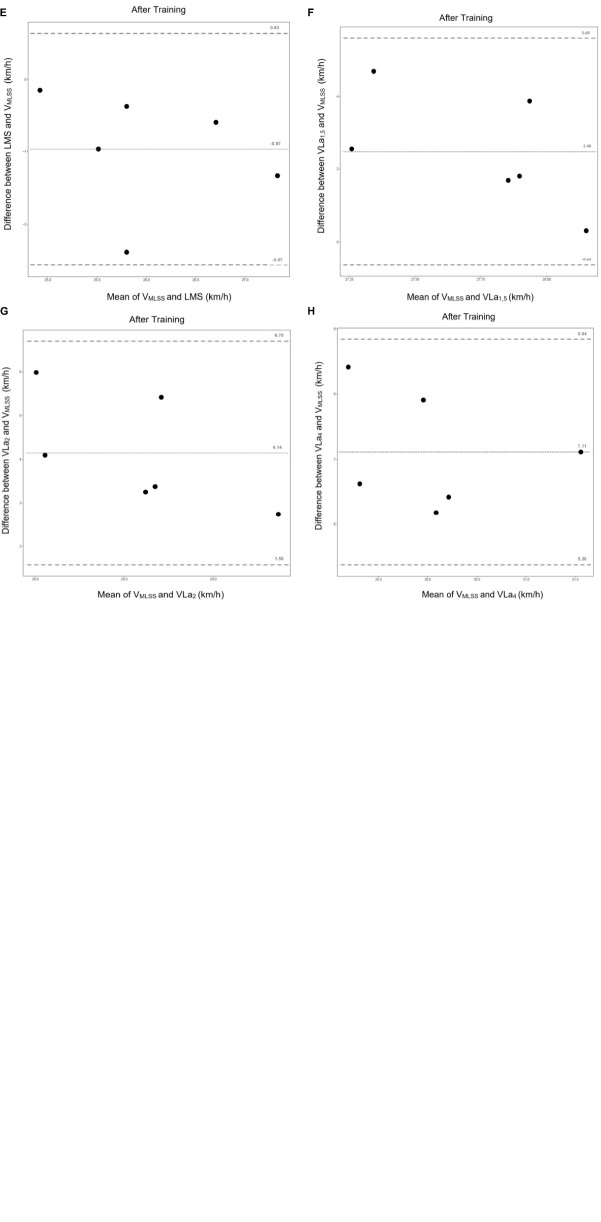
FIGURE 6.
Bland-Altman plots with the mean bias and the 95% agreement CI for comparison between velocities of the MLSS vs. LMS (A,E), VLa1,5 (B,F), VLa2 (C,G), and VLa4 (D,H) with (A–D) before the 8 weeks of training and (E–H) after 8 weeks of training. For each plot: the dotted line in the centre represents the mean bias and the upper and lower dotted line delimit of the 95% limits of agreement for the mean bias.

