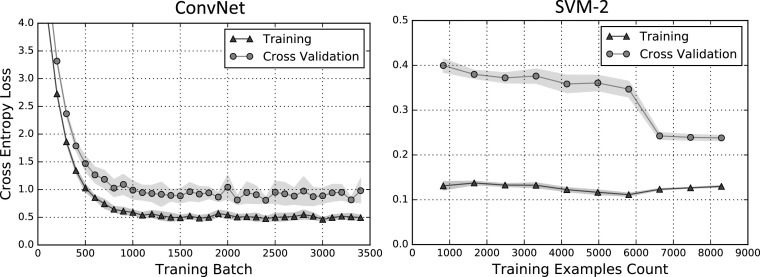
Fig. 5.
Learning curves for ConvNet and SVM-2 models. The performance metric, cross entropy loss, has an optimal value of zero. For the ConvNet model (left), each training batch contains 64 tweets (115 training batches is approximately one epoch, i.e., 7360 training examples). Note that for the ConvNet model, training samples are repeated across epochs. Performance is evaluated by fivefold cross-validation. The symbols indicate the mean value over the fivefolds and the shaded region indicates one standard deviation. Behavior for the SVM-1 model (not shown) is similar to that of the SVM-2 model

