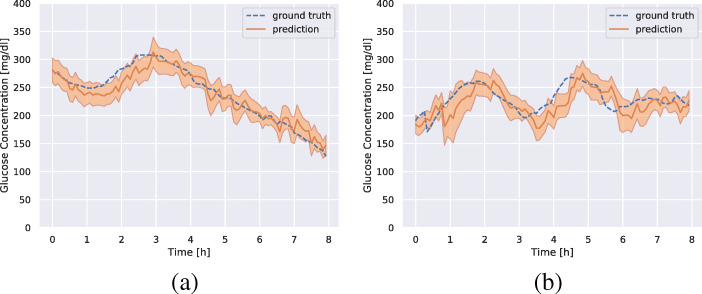
Fig. 3.
Prediction (orange), predicted standard deviation (shaded orange), and the ground truth glucose concentration (dashed blue) for patients 570 (a) and 575 (b). The plot shows 8 h of predictions starting from an arbitrarily chosen time for each patient in the test data. The predictions are 30 min into the future

