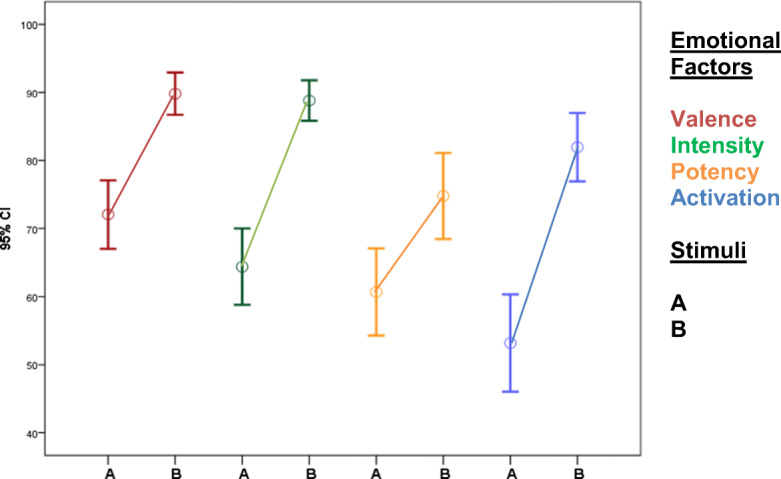
Fig. 5.

Perception of emotional factors via video-based communication. The graphs draw an error bar of emotional factors scored across the stimuli. The lines in figure provide the expectation that there are overall changes in the trends of emotional factors. According to the lines, the factors are perceived higher in the second stimulus
