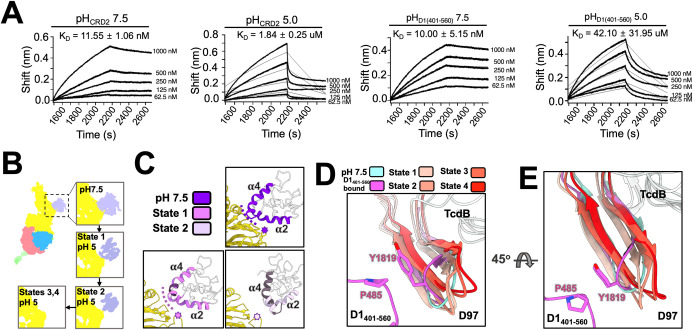
Fig 3. Interactions between TcdB and its receptors under different pHs.
(A) Binding kinetics between TcdB and receptors are measured by BLI. The calculated binding affinities of TcdB to the 2 receptors, under pH 7.5 or pH 5, are labeled above each diagram. This measurement was calculated based on 2 biological replicates with standard deviations listed for each sample (raw data in S3 Data). (B) The structure comparisons of the TcdB-CRD2 complex at pH 7.5 and the 2 states at pH 5. (C) The helices (α2 and α4) of CRD2 that interact with TcdB are colored for each state. Dashed curves label the CRD-binding groove. Stars label the CRD-binding loop. Dark gray color labels regions in α-helices 2 and 4 that lack the cryo-EM density. The buried surface areas, calculated based on the model for the complex of TcdB and CRD2 under pH 7.5, state 1 and state 2 are around 700, 150, and 80 Å2, respectively. (D) The movement of the β-sheet (residues 1,812–1,827) in the D97 region are shown and color coded for each state. Tyr1819 of TcdB and its interaction partner Pro485 of CSPG4 are shown. (E) The same region rotated 90° from Panel D. BLI, bio-layer interferometry; CRD, cysteine-rich domain; CRD2, cysteine-rich domain of frizzled-2; TcdB, Toxin B.

