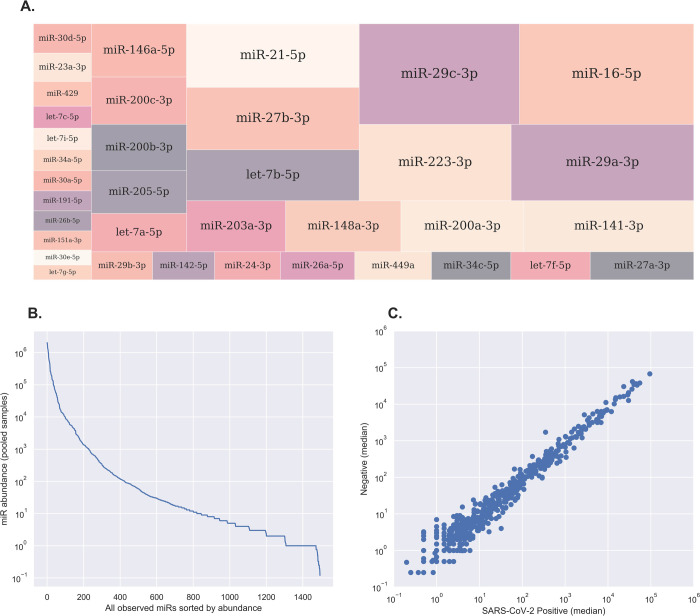
Fig 1. Overview of host-encoded miRNAs in nasal swab samples.
A, Treemap plot displaying the relative abundance of the most highly-expressed miRNAs in nasal swab samples. The most prevalent miRNA was miR-16-5p, followed by miR-29a-3p, miR-29c-3p and miR-223-3p. B, Line plot showing the relative abundance of all host miRNAs identified in nasal swab samples. A total of 1495 miRNAs were detected across all 20 samples, of which 452 were detected at greater than 100 reads. C, Scatter plot illustrating inter-sample variance at the single-miRNA level. Each individual point represents a single mature miRNA, shown as the median of DESeq2-normalized read counts in each group and drawn in log10 scale on both axes. MiRNAs that lie exactly on the diagonal midline have equal expression in both groups, while miRNAs located further away from the midline are potential candidates for differential expression.

