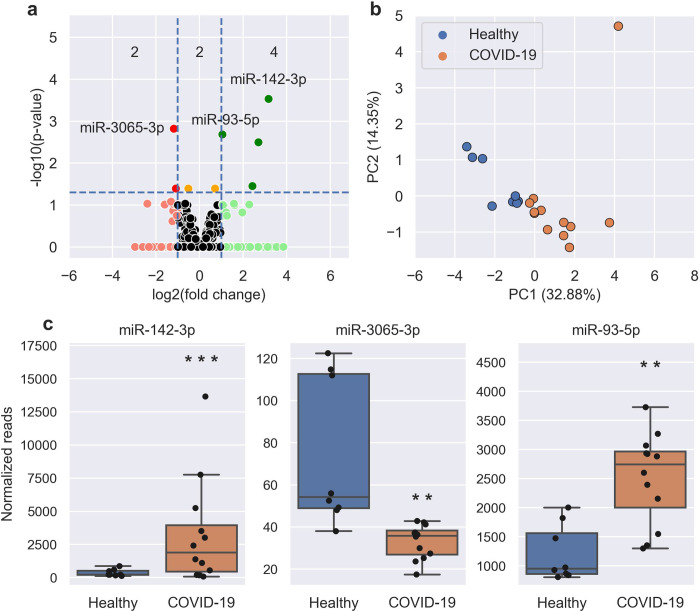
Fig 2. SARS-CoV-2 induces significant chances in the miRNA profile from patient nasal swabs.
A, Volcano plot showing the increased (green) and decreased (red) DE miRNAs in COVID-19 patients when compared to healthy controls. Horizontal dotted line is the p-value cut-off (False Discovery Rate, FDR<0.05) and the vertical lines are the fold change cut-off (>2 FC). Orange miRNAs are statistically significant but are not >2 FC. The number of statistically significant miRNAs (adjusted P-value <0.05) in each section are shown: <-1 Log2 FC (2 miRNAs), between –1 and 1 Log2 FC (2 miRNAs), and >1 Log2 FC (4 miRNAs). The most up-regulated, down-regulated, and statistically significant miRNAs have been labelled. B, PCA plot showing the separation of healthy (blue) and COVID-19 (orange) samples using the 8 DE miRNAs. C, Boxplots of select miRNAs in healthy (blue) and COVID-19 (orange) samples. Boxes are the 25th - 75th percentile, line is the median, and whiskers are 1.5x IQR. ** p-value < 0.01, *** p-value < 0.001.

