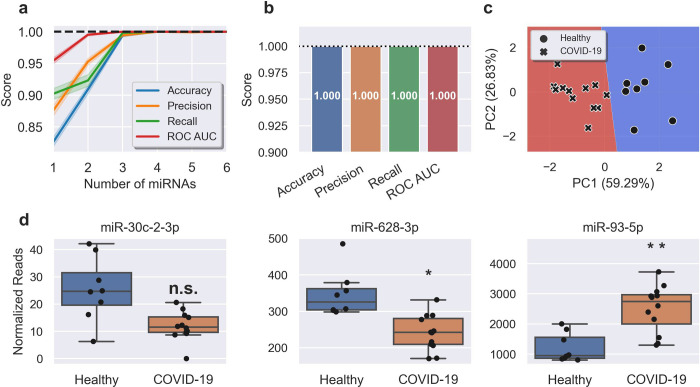
Fig 4. A miRNA signature in nasal swabs classifies COVID with 100% accuracy.
A, Feature (miRNA) selection lineplot showing the impact of increasing numbers of miRNAs on the performance of a logistic regression model. MicroRNAs were selected using recursive feature elimination to identify the most important miRNAs. Each combination of miRNAs was randomly assessed 1,000 times. Shaded areas are the 95% CI, and the dotted line is a perfect (100%) score. B, Barplot showing the average score of the three-miRNA signature in predicting healthy controls and COVID-19 patients. Error bars are the 95% CI after 1,000 random iterative assessments. C, Decision boundary graph showing the logistic regression decision point (solid black line) and the probability a person is infected with SARS-CoV-2 (blue to red shading). Datapoints are healthy (circles) and COVID-19 (crosses) samples. D, Boxplots of each of the signature miRNAs in healthy (blue) and COVID-19 (orange) samples. Boxes are the 25th - 75th percentile, line is the median, and whiskers are 1.5x IQR. * FDR adjusted p-value < 0.05, ** FDR adjusted p-value < 0.01. n.s. non-significant.

