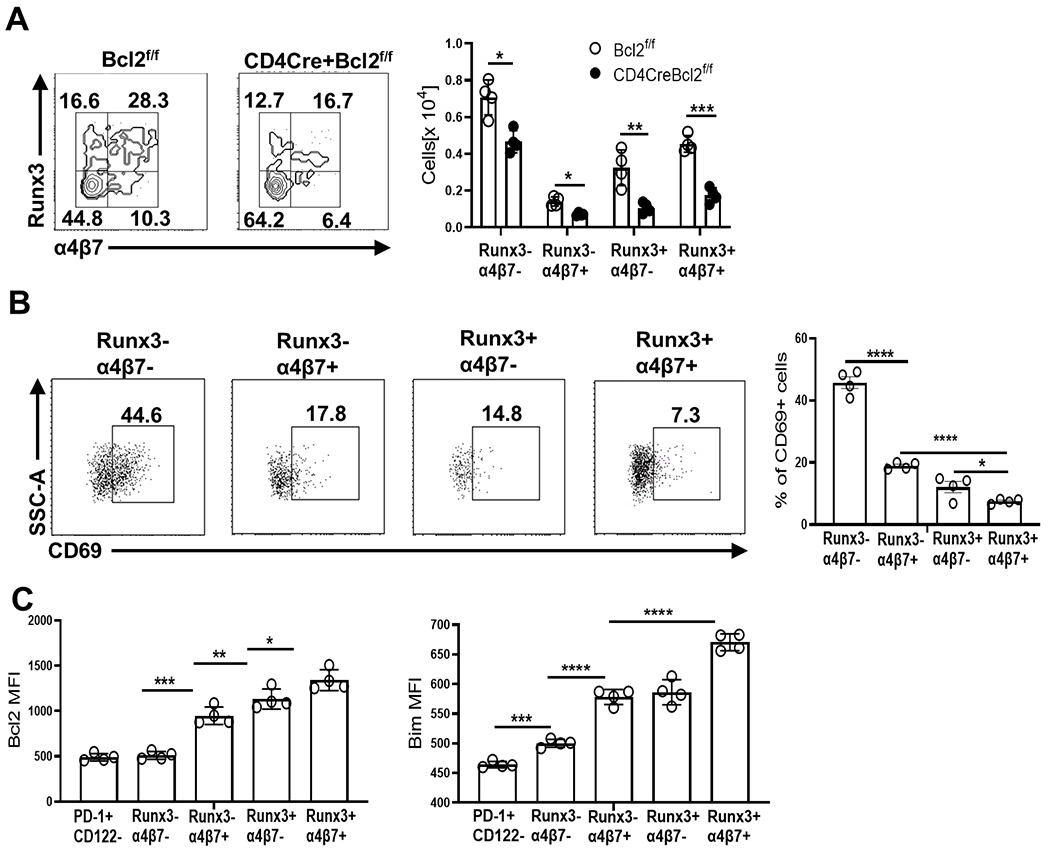
Fig 3. Runx3 expression marks a mature IELp sub-population among PD-1+ CD122+ thymocytes that critically depends on Bcl-2 for survival.

(A) Flow cytometric identification of Runx3− α4β7− , Runx3− α4β7+, Runx3+ α4β7− and Runx3+ α4β7+ sub-populations within PD0-1+ CD122+ CD44lo post-selected DN thymocytes. The bar graphs show the numbers of each population from Bcl2f/f (open circle) and CD4CreBcl2f/f (filled circle) mice. (B) Representative dot plots and bar graphs show the percentage of CD69+ cells among sub-populations of PD-1+ CD122+ CD44lo thymocytes in WT mice (C) Bar graphs show the MFI of Bcl-2 and Bim in the sub-populations of PD-1+ CD122+CD44lo thymocytes from WT mice in comparison to PD-1+ CD122− cells. Results are representative of 3 independent experiments with n=3 or more mice per group and show mean ± SD. *p < 0.05, **p < 0.01, ***p < 0.001, ***p < 0.0001 Student’s t test.
