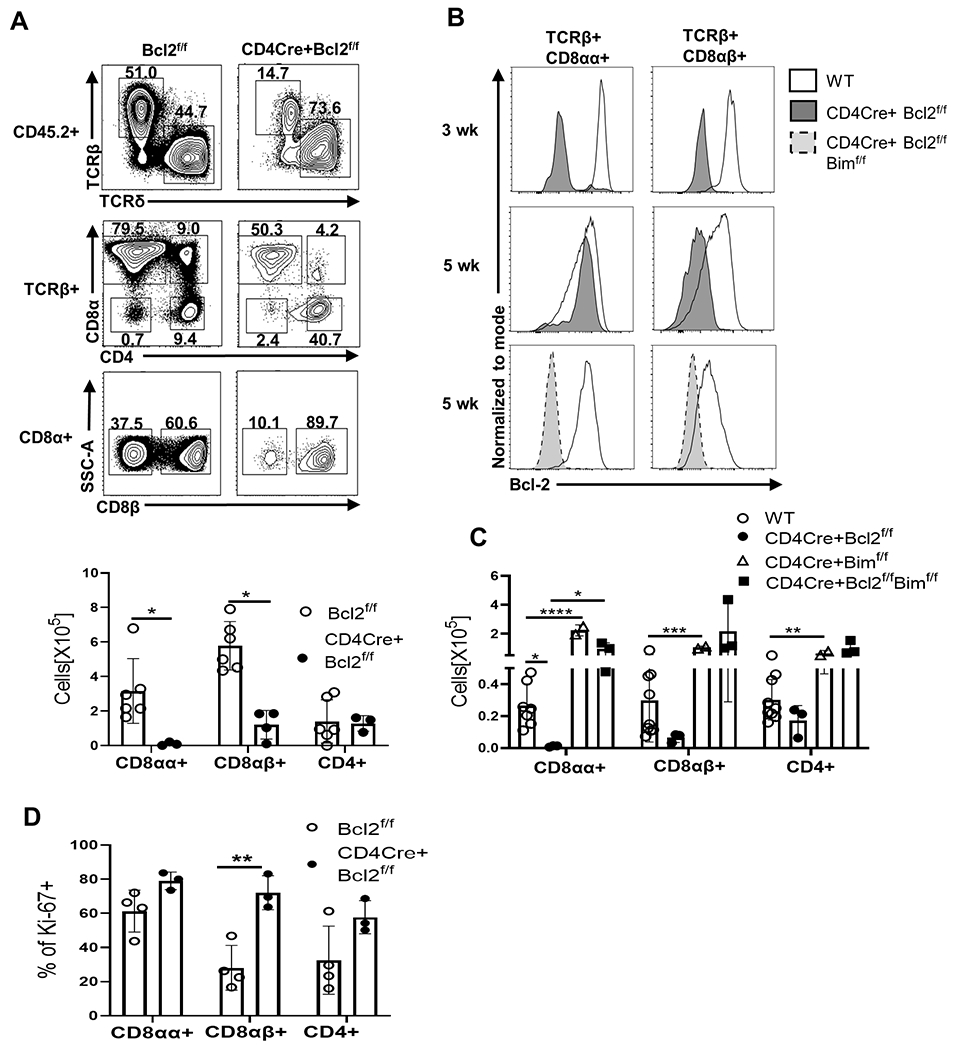
Fig 5. Thymic deletion of Bcl-2 leads to a profound loss of TCRαβ+ CD8αα+ IEL.

(A)Representative dot plots indicate frequency of gut IEL populations ( gated from live, CD45.2+ cells) and show TCRβ+ and TCRδ+ IEL(top row), CD8α and CD4 expression among TCRβ+ IEL(middle row) and CD8β expression among the CD8α+ IEL ( bottom row) .The bar graph shows the numbers of TCRαβ+ CD8αα+, TCRαβ+ CD8αβ+ and TCRαβ+ CD4+ IEL from 8 week old Bcl2f/f (open circle) and CD4CreBcl2f/f (filled circle) mice. (B) Histograms show Bcl-2 expression in TCRαβ+ CD8αα+ IEL (left column) and TCRαβ+ CD8αβ+ IEL (right column) from 3 week old and 5 week old WT (solid no fill) and CD4CreBcl2f/f (solid grey fill) mice and 5 week old WT (solid no fill) and CD4CreBcl2f/f Bimf/f (dashed light grey fill) mice. (C) Bar graphs show numbers of IEL in WT (open circle) and CD4CreBcl2f/f (filled circle) at 3 weeks of age and CD4CreBimf/f (open triangle) and CD4CreBimf/f Bcl2f/f (filled square) at 5 weeks of age. D) Bar graph shows the frequency of Ki-(A) 67+ cells among TCRαβ+ CD8αα+, TCRαβ+ CD8αβ+ and TCRαβ+ CD4+ IEL from 3 week old Bcl2f/f mice (open circles) and CD4Cre+Bcl2f/f mice (filled circles). Results are representative of at least 3 independent experiments with n=3 or more mice per group and show mean ± SD. *p < 0.05, **p < 0.01, ***p < 0.001, **** p < 0.0001 Student’s t test.
