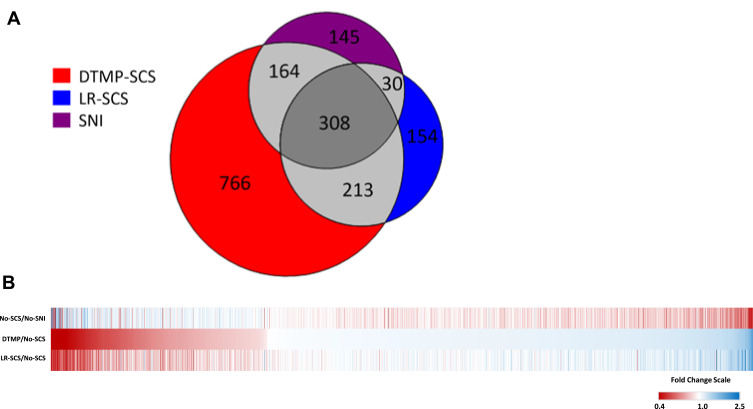
Figure 1.
(A) Venn diagram accounting for proteins significantly affected by the pain model and both SCS treatment groups. The pain model significantly affected 647 proteins (purple circle), DTMP affected 1451 proteins (red circle), and LR-SCS affected 705 proteins (blue circle). Regions of overlap indicate the number of shared significantly affected proteins between the groups. (B) Heat map of proteins significantly regulated by DTMP relative to No-SCS (DTMP/No-SCS) and in comparison, to the effect of LR-SCS (LR-SCS/No-SCS) and the effect of the pain model relative to uninjured animals (No-SCS/No-SNI). Red color represents decreased expression, blue depicts increased fold changes, and white stands for no change.

