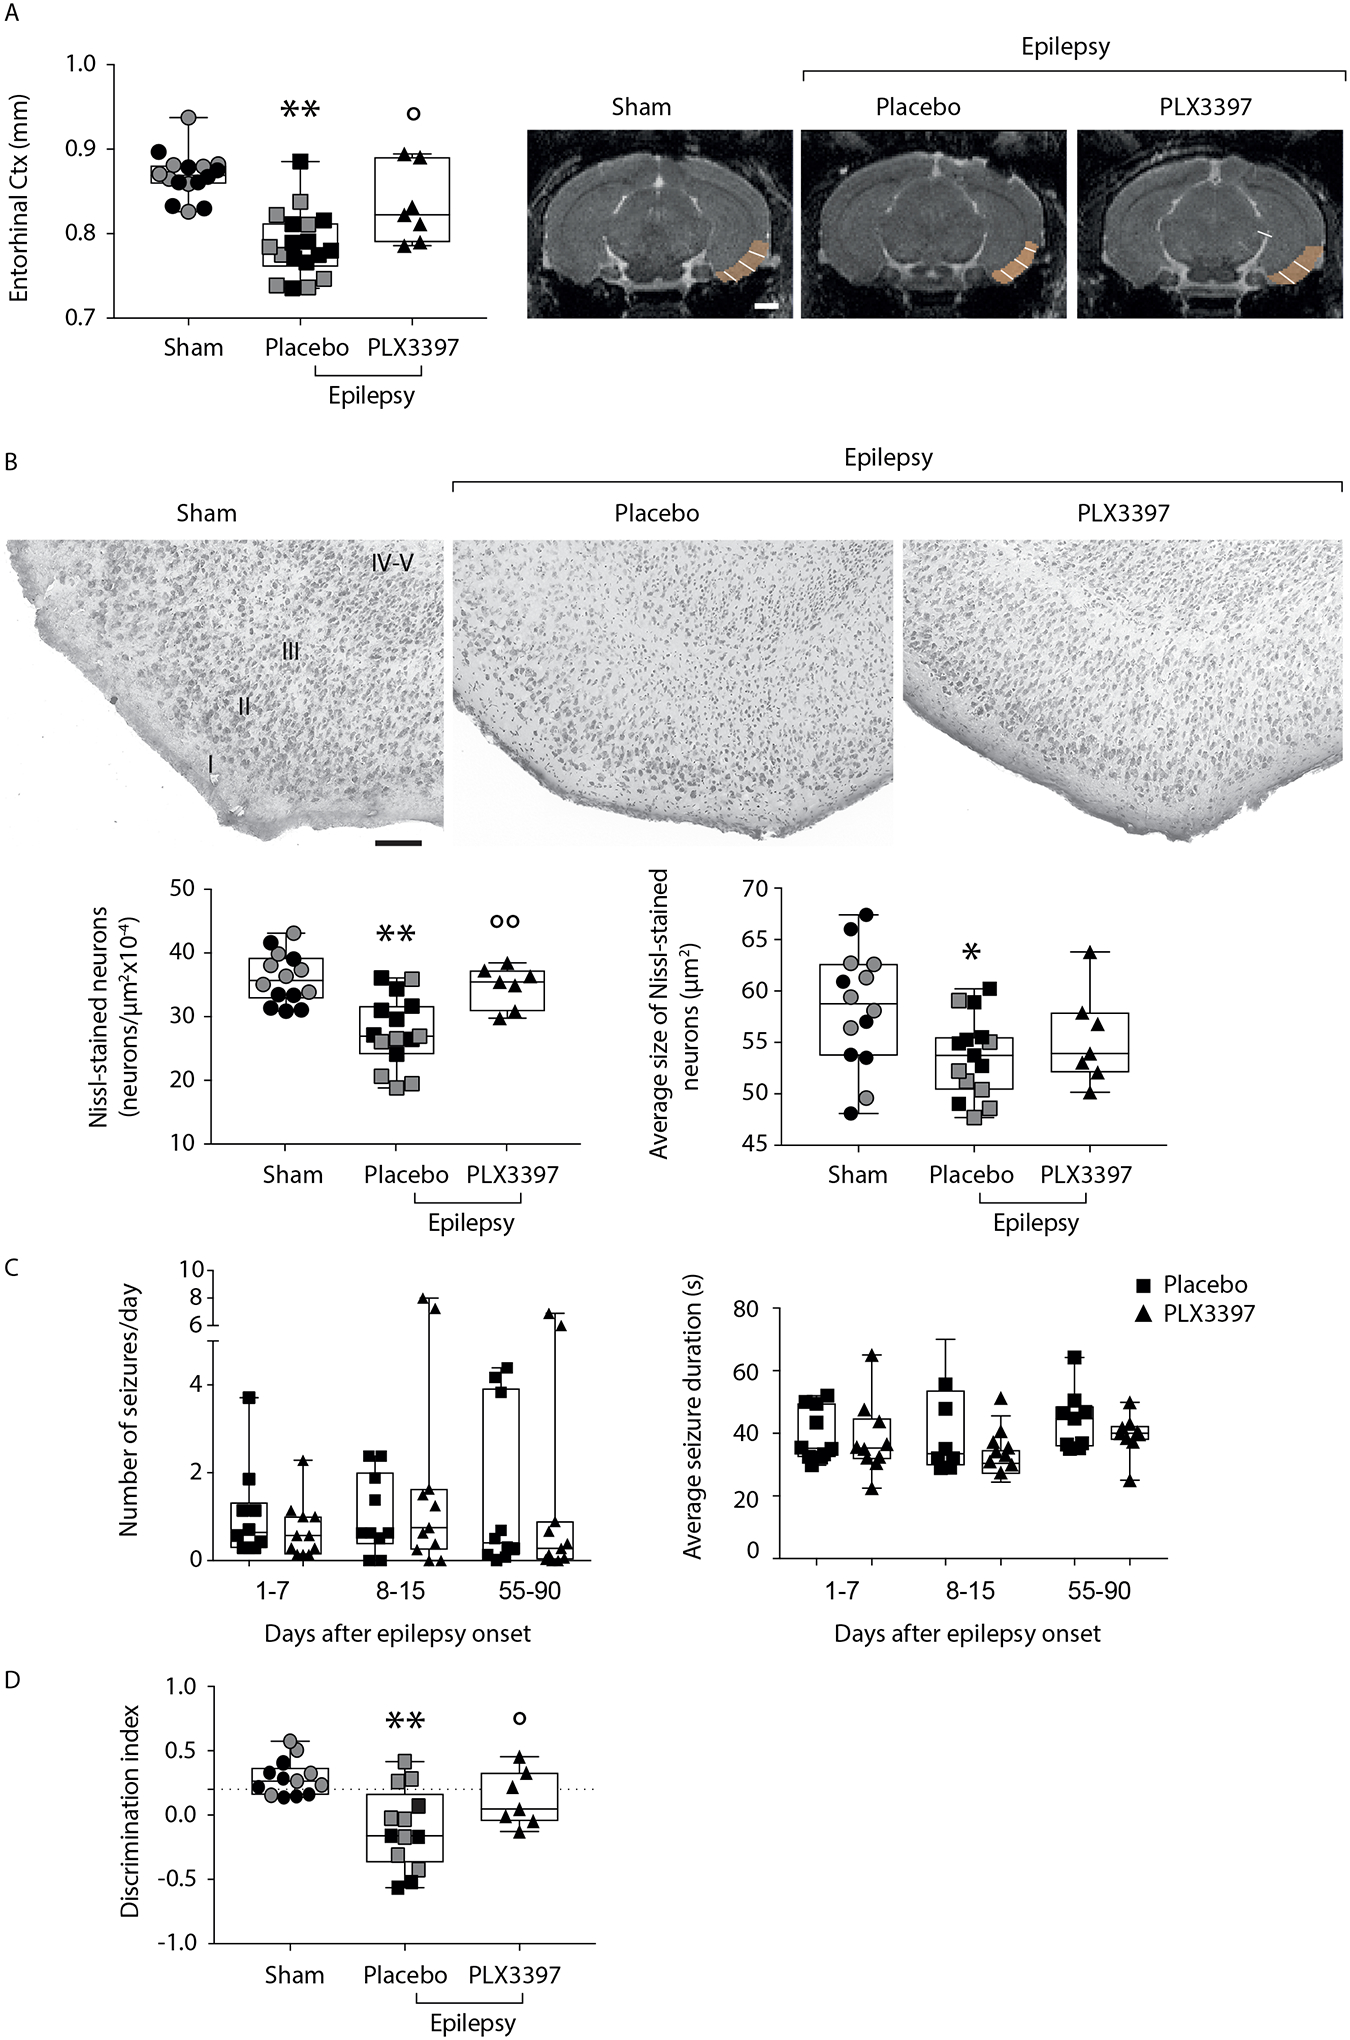
Fig. 3. Effects of microglia depletion in the early disease phase on entorhinal cortex thickness and neuronal cell loss, and on cognitive deficit in epileptic mice.

The experimental design is depicted in Fig. S1A. Grey symbols represent sham (n=6–8) and epileptic mice fed with placebo diet (n=8) run in parallel with experimental mice of Fig 3C (see text for details).
Panel A: box-and-whisker plots depicting median, minimum, maximum and single values related to the entorhinal cortex thickness, as assessed by quantitative post mortem MRI analysis performed in epileptic mice at the end of EEG monitoring (placebo are mice fed with non-medicated diet: n=18; PLX3397 are mice fed with medicated diet supplemented with PLX3397: n=7), and in sham mice (not exposed to status epilepticus; n=16). MRI images depict representative slices showing the ROI used to quantify the cortical thickness. Four mice in the PLX3397 group did not undergo MRI analysis and therefore they were not included in the subsequent histological (B) and behavioral analyses (D). The white line within the ROI was manually drawn to measure the cortical thickness. **P=0.0001 vs sham; °P=0.022 vs placebo by ANOVA followed by Tukey’s test. Scale bar: 1 cm.
Panel B: representative Nissl-stained sections (top row) of the entorhinal cortex in the experimental groups (top row; sham, n=14; placebo, n=15; PLX3397, n=7), and the relative quantification of the number and the average size of Nissl-stained neurons (bottom row). Two sham and three placebo mice were excluded from the analysis due to poor quality of Nissl staining. Data are shown by box-and-whisker plots depicting median, minimum, maximum and single values *P=0.0037, **P=0.0001 vs sham; °°P=0.006 vs placebo diet by ANOVA followed by Tukey’s test. Scale bars: 100 μm.
Panel C: box-and-whisker plots depicting median, minimum, maximum and single values of the number of spontaneous seizures/day and their average duration during days 1–7, 8–15 and 55–90 from epilepsy onset (day 1) in the placebo (n=10) and PLX3397-supplemented diet (n=11) experimental groups (protocol in Fig. S1A). Friedman’s two-way nonparametric ANOVA (p=0.041) followed by post-hoc multiple comparisons test with Bonferroni correction: P-values for Number of seizures/day: p=0.363, days 1–7; p=0.339, days 8–15; p=0.965, days 55–90; P-values for Seizures duration: p=0.799, days 1–7; p=0.325, days 8–15; p=0.262, days 55–90.
Outliers were identified only for the Number of seizures/day in the placebo group (n=1 in days 1–7) and in the PLX3397 group (n=2 in days 8–15 and n=2 in days 55–90), however, their omission did not change the results of the primary statistical analysis therefore the values were not removed from the corresponding data set (P-values for sensitivity analysis: p=0.831, days 1–7; p=0.375, days 8–15; p=0.084, days 55–90).
Panel D: Novel object recognition test (NORT) in epileptic mice fed with placebo- (n=13) or PLX3397-supplemented diet (n=7), and sham controls (n=13). Three sham and five placebo diet epileptic mice were excluded from the analysis since they showed a total exploration time <6 sec during the familiarisation phase. Memory was evaluated by measuring the discrimination index, which was calculated as time spent (sec) exploring the familiar (F) and the novel (N) object as follows: (N - F)/(N + F). Data are shown by box-and-whisker plots depicting median, minimum, maximum and single values, differences significant at **P=0.0004 vs sham by ANOVA followed by Tukey’s test; *P=0.049 vs placebo by Mann-Whitney test.
