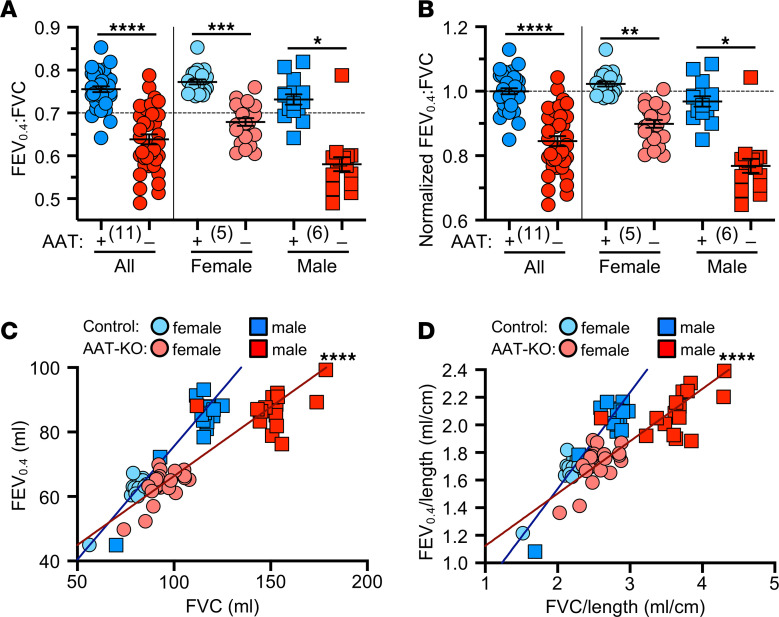
Figure 3. Absence of AAT is sufficient to cause airflow limitation and obstruction.
(A) Ratio of FEV0.4 to FVC for AAT-KO and control ferrets, broken down by sex to the right of the vertical line (n = 35–38 experiments in 11 paired animals; P value by mixed effects model, P = 0.000026 for both sexes together, P = 0.00029 for females, and P = 0.048 for males). (B) Normalized FEV0.4:FVC ratio where controls are set to 1, broken down by sex to the right of the vertical line (n = 35–38 experiments in 11 paired animals; P value by mixed effects model, P = 0.000031 for both sexes together, P = 0.0032 for females, and P = 0.048 for males). (C and D) FEV0.4 plotted against FVC for each animal as (C) raw volume and (D) normalized by body length (n = 35–38 experiments in 11 paired animals; P value by mixed effects model fit to each genotype to compare slopes; P = 9.362 × 10⁻⁶ for C and P = 4.621 × 10⁻⁶ for D). (A and B) Mean ± SEM with the biological n in parentheses; the same data are presented in C and D. *P < 0.05; **P < 0.01; ***P < 0.001; ****P < 0.0001.

