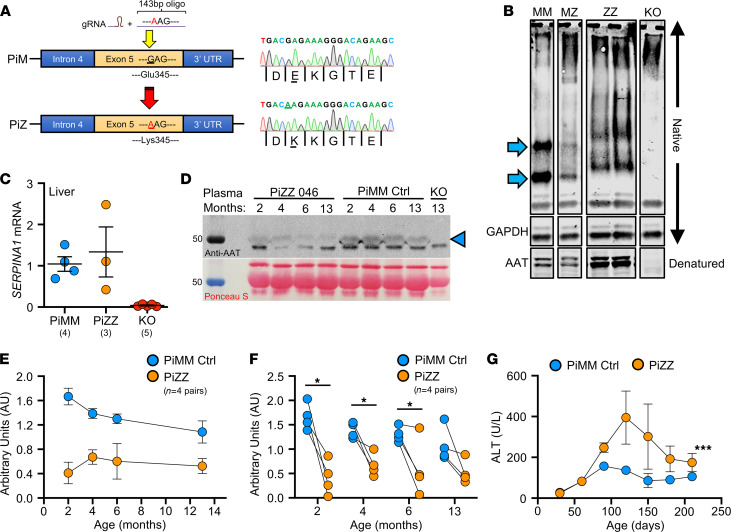
Figure 6. Generation of a PiZZ ferret model of AATD and characterization of hepatic disease.
(A) Schematic depiction of CRISPR/Cas9-mediated Z-allele knockin (with donor oligo) in exon 5 of the SERPINA1 locus. Founders were confirmed by Sanger sequencing (at right). (B) Representative lanes from native PAGE gel performed on liver tissue lysates showing change in band migration of the PiZ protein. Arrows mark the PiMM (MM) control bands that are shifted in PiZZ (ZZ) samples and absent in the AAT-KO sample. PiMZ (MZ) shows a combined pattern. GAPDH is shown as loading control for the native PAGE. Denatured samples were separated by SDS-PAGE and probed for AAT at the bottom of the panel. (C) mRNA expression of SERPINA1 in PiZZ ferret liver tissue compared with PiMM controls and AAT-KO nulls (n = 3–5 ferrets/group as indicated). (D) Western blot of plasma from a representative PiZZ ferret and age-matched PiMM control showing change in circulating AAT over time (AAT band marked by arrowhead). Timed blood draws in PiZZ and PiMM ferrets at 2, 4, 6, and 13 months old; AAT-KO ferret drawn at 13 months old as negative control. Below is the Ponceau stain used for loading control. (E) Densitometric quantification of plasma AAT (normalized to Ponceau band) over time in 4 pairs of PiZZ and PiMM control ferrets. (F) Comparison of plasma AAT at each blood draw (n = 4 pairs at each time point; P value by paired Student’s t test, *P < 0.05). (G) Levels of plasma ALT over time in PiZZ and PiMM control ferrets (n = 2–5 ferrets at each time point; P value by mixed effects model, ***P = 0.00014). In C and E–G, blue = PiMM controls, yellow = PiZZ, and in C, red = AAT-KO. All graphs show mean ± SEM; some error bars are hidden by symbols. *P < 0.05; ***P < 0.001.

