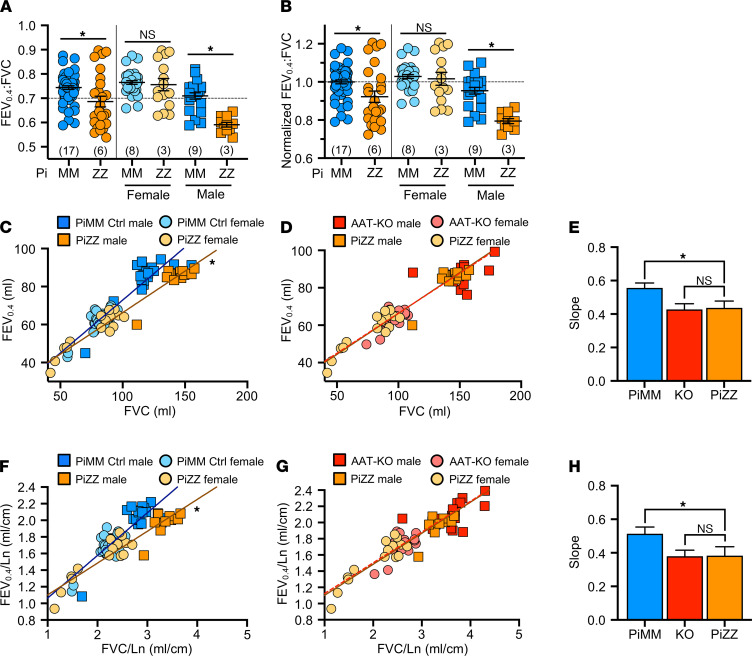
Figure 8. PiZZ ferrets develop airflow obstruction.
(A) FEV0.4:FVC ratio for PiZZ and PiMM controls, separated by sex to the right of the vertical line (n = 26–58 experiments in 6 PiZZ and 17 PiMM controls; P value by mixed effects model, P = 0.026 for both sexes, P = 0.54 for females, and P = 0.016 for males). (B) Normalized FEV0.4:FVC ratio with controls set to 1, separated by sex to the right of the vertical line (n = 26–58 experiments in 6 PiZZ and 17 PiMM controls; P value by mixed effects model, P = 0.016 for both sexes, P = 0.45 for females, and P = 0.013 for males). (C and D) FEV0.4 plotted against FVC for each animal where (C) compares PiZZ and PiMM controls and (D) compares PiZZ and AAT-KO ferrets (n = 26–58 experiments in 6 PiZZ and 17 PiMM controls; P value by mixed effects model fit to each genotype, P = 0.014 for C and P = 0.25 for D). (E) Slope of the mixed effects model fit for each genotype in C and D are compared (P value by mixed effects model interaction, P = 0.014 for PiZZ vs. PiMM controls and P = 0.25 for PiZZ vs. AAT-KO). (F and G) FEV0.4 plotted against FVC, normalized by body length (FEV0.4/Ln vs. FVC/Ln), for each animal, where (F) compares PiZZ and PiMM controls and (G) compares PiZZ and AAT-KO ferrets (n = 26–58 experiments in 6 PiZZ and 17 PiMM controls; P value by mixed effects model fit to each genotype, P = 0.026 for F and P = 0.25 for G). (H) Slope of the mixed effects models fit to genotype in F and G are compared (P value by mixed effects model interaction, P = 0.026 for PiZZ vs. PiMM controls and P = 0.25 for PiZZ vs. AAT-KO). In all panels, blue = PiMM controls, orange = PiZZ, and red = AAT-KO. Squares are males and circles female. In E and H, the bar represents the mean ± SEM for the slope calculated by mixed effects model. *P < 0.05.

