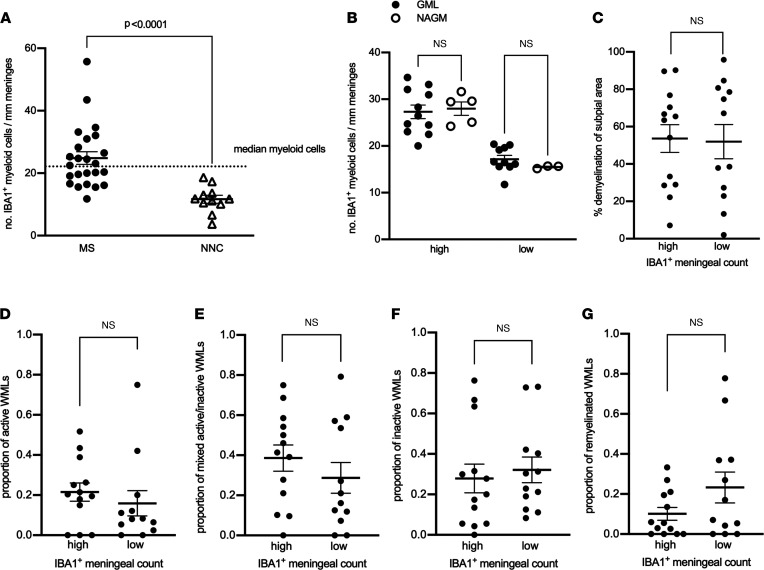
Figure 3. Meningeal myeloid cells are enriched in MS but not topographically linked to subpial demyelination or to the extent of cortical subpial demyelination or to subcortical white matter lesion activity.
(A) Quantification of meningeal IBA1+ myeloid cell count in MS donors and nonneurological controls (NNCs) showing enrichment in 27 MS donors compared with 9 NNCs. The median for meningeal IBA1+ myeloid cell count (shown by the dotted line) was used to stratify MS donors in high versus low meningeal myeloid cell count. (B) Quantification of meningeal IBA1+ myeloid cell count showing no significant changes in the number of meningeal myeloid cells adjacent to GML versus NAGM in MS donors with high (n = 14) or low (n = 13) meningeal myeloid cell count. (C) Quantification of the proportion of subpial gray matter that did not stain positive for myelin in MS donors with high versus low meningeal IBA1+ myeloid cell count. (D–G) Quantification of (D) proportion of active white matter lesions (WMLs), (E) mixed active/inactive WMLs, (F) number of inactive WMLs, and (G) number of remyelinated WMLs in MS donors with high versus low meningeal IBA1+ myeloid cell count. Each data point represents the proportion of WMLs in all tissue blocks analyzed per case (range 5–72 blocks, median: 30 blocks per donor). In A and C–G, statistically significant differences were determined by nonparametric Mann-Whitney test. In B, statistically significant differences were determined by nonparametric Kruskal-Wallis test followed by Dunn’s correction for multiple comparisons.

