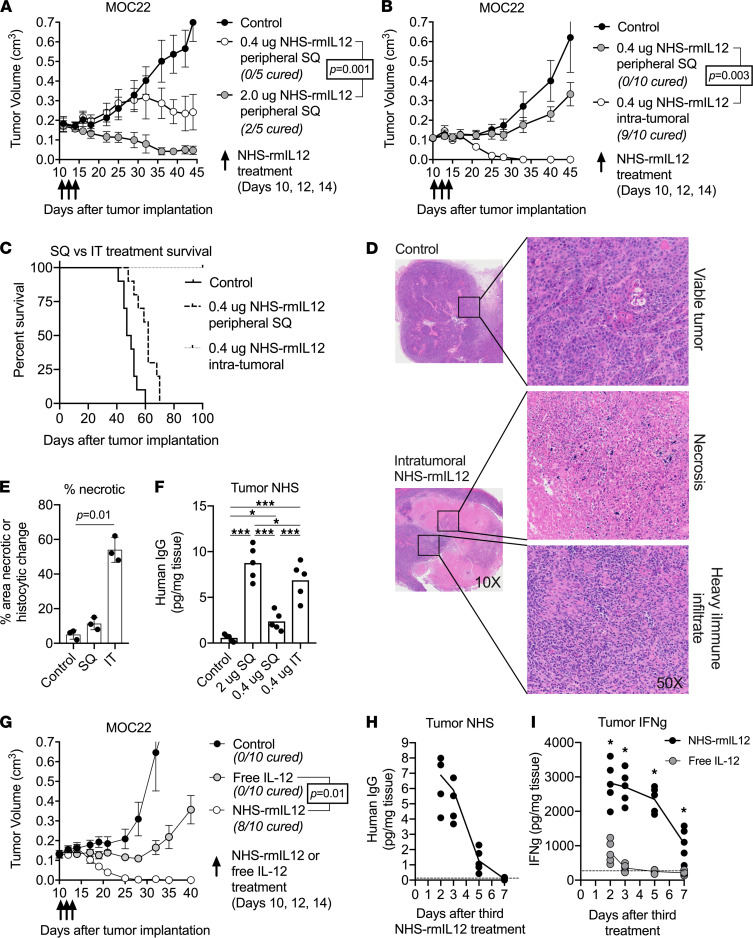
Figure 1. Dose-reduced tumor targeted NHS–rmIL-12 eradicates established oral cancers.
(A) WT B6 mice (n = 5/group) bearing established MOC22 carcinomas were treated with PBS control, high-dose (2.0 μg) or low-dose (0.4 μg) peripheral s.c. NHS–rmIL-12. Significance determined by 2-way ANOVA. (B) Mice (n = 10/group) bearing established MOC22 tumors were treated with 3 doses of PBS control or peripheral s.c. or i.t. low-dose NHS–rmIL-12. Significance determined by 2-way ANOVA. (C) Survival curve of MOC22 tumor–bearing mice (n = 15/group) treated with peripheral s.c. or i.t. low-dose NHS–rmIL-12 over 3 independent experiments. (D) Forty-eight hours after the third PBS control or low-dose i.t. NHS–rmIL-12 treatment, tumors (n = 3/group) were harvested, stained with H&E, and assessed for histologic changes via microscopy. Focal areas of interest from 10× magnification photomicrographs enlarged to 50× magnification are shown. (E) The percentage of tumor area necrosis in PBS control or low-dose peripheral s.c. or i.t. NHS–rmIL-12–treated tumors (n = 3/group) was quantified via digital annotation in QuPath. Significance determined by 1-way ANOVA. (F) Forty-eight hours after the third PBS control, peripheral s.c. high- or low-dose or i.t. low-dose NHS–rmIL-12 treatment, MOC22 tumors (n = 5/group) were harvested and digested, and human IgG concentrations were measured from tumor supernatant via ELISA. Significance determined by 1-way ANOVA. (G) Mice (n = 10/group) bearing established MOC22 tumors were treated with PBS control, i.t. low-dose NHS–rmIL-12, or dose equivalent (0.29 μg) free IL-12. Significance determined by 2-way ANOVA. (H) A time course of human IgG concentration was measured in MOC22 tumor supernatants (n = 5/group) following 3 low-dose i.t. NHS–rmIL-12 treatments. The dashed horizontal line represents human IgG levels in MOC22 tumors treated with PBS control. (I) A time course of IFN-γ concentration was measured in MOC22 tumor supernatants (n = 5/group) via ELISA following 3 low-dose i.t. NHS–rmIL-12or free IL-12 treatments. Asterisks indicate a significant difference (P < 0.05) between NHS–rmIL-12 and free IL-12 determined by a 2-tailed Student t test. The dashed horizontal line represents human IgG levels in MOC22 tumors treated with PBS control. *P < 0.05; ***P < 0.001.

