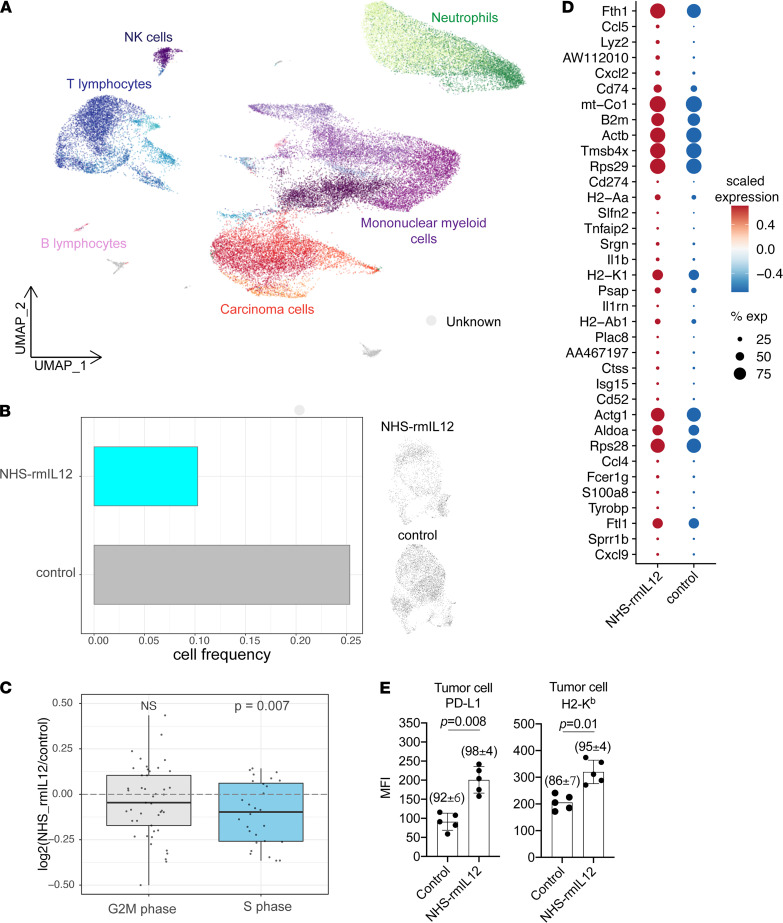
Figure 3. NHS–rmIL-12 treatment results in reduced viability and enhanced immunogenicity of tumor cells.
(A) UMAP embedding shows 44,036 single cells obtained 48 hours after the third PBS control or NHS–rmIL-12 treatment from 2 tumors per condition. Cell types were identified using clustering and marker gene expression analysis (Supplemental Figure 5). (B) Bar graph shows fraction of carcinoma cells in tumors treated with PBS control or NHS–rmIL-12 (left panel). UMAP embedding shows carcinoma cells from tumors treated with PBS control or NHS–rmIL-12 (right panel). (C) Box plot show log2-transformed fold changes in average expression of G2M- or S phase–associated genes comparing NHS–rmIL-12– and control-treated carcinoma cells. Wilcoxon signed-rank test was used to determine statistical significance. (D) Dot plot shows expression of genes upregulated (adjusted P ≤ 0.05) in NHS–rmIL-12-–treated carcinoma cells. Circle color corresponds to scaled average expression; circle size denotes fraction of cells with nonzero gene expression of corresponding gene. (E) Bar graph shows median fluorescence intensity (MFI) of cell surface PD-L1 and MHC class I (H2-Kb) on CD45–CD31–PDGFR– tumor cells measured by flow cytometry 48 hours after treatment with NHS–rmIL-12 or PBS control. P value determined by Student’s t test.

