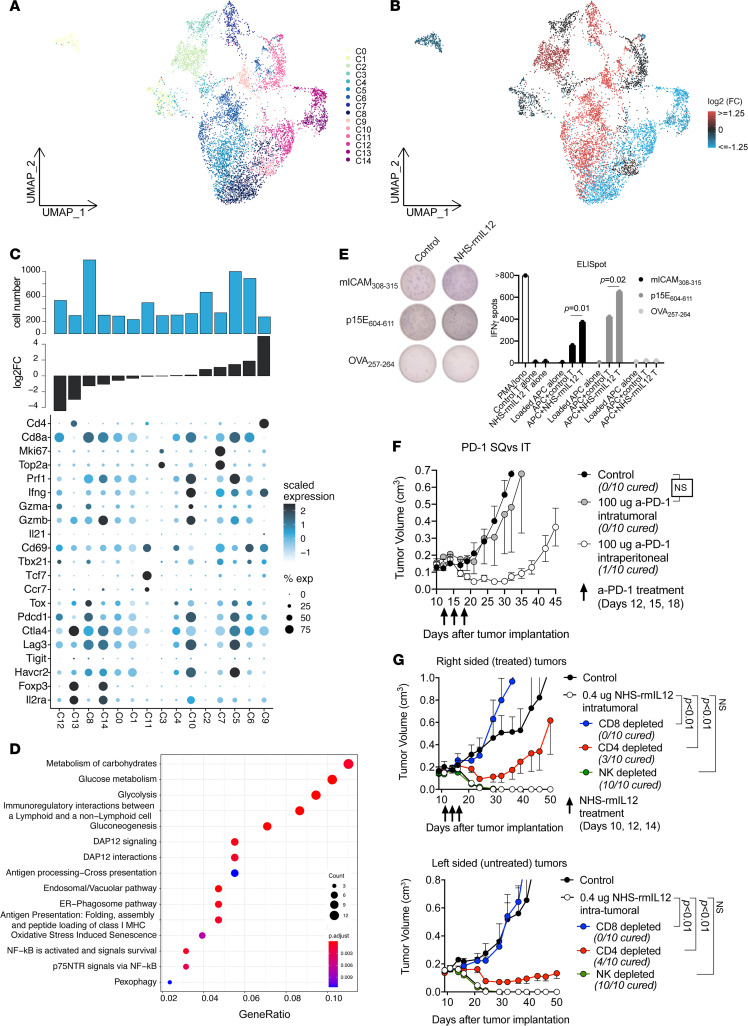
Figure 4. NHS–rmIL-12 promotes Th1 immunity and reinvigorates exhausted antigen-specific CD8+ T lymphocytes.
(A) UMAP embedding of T lymphocytes colored by cluster identity. (B) UMAP embedding of T lymphocytes; clusters were colored by log2 fold change in relative cell abundance in NHS–rmIL-12– and PBS control-treated tumors. Red represents a relative increase, and blue a relative decrease in cell frequency following treatment with NHS–rmIL-12. (C) Dot plot showing expression of select T lymphocyte–related genes across T lymphocyte clusters sorted by fold change in relative cell abundance comparing cells from NHS–rmIL-12– to control-treated tumors (lower bar graph). Circle color corresponds to scaled average expression; circle size denotes fraction of cells with nonzero gene expression of corresponding gene. Top bar graph represents total cell number. (D) Dot plot showing Reactome terms enriched in genes upregulated by NHS–rmIL-12 treatment within cells of clusters 5 and 8. (E) Antigen specificity of cultured TIL from tumors treated with NHS–rmIL-12 or PBS control following coculture with antigen-presenting cells pulsed with the neoepitope mICAM308-315, shared epitope p15E604-611, or control epitope OVA257-264, measured via ELISpot assay. Significance determined by 1-way ANOVA. (F) Mice (n = 10/group) bearing established MOC22 tumors were treated with 3 doses of i.t. or i.p. PD-1 mAb clone RPM1-14 (100 μg) or isotype (rat IgG2a) control and followed for tumor growth. Significance determined by 2-way ANOVA. (G) Mice bearing established MOC22 tumors in bilateral flanks were treated with unilateral (right sided) low-dose i.t. NHS–rmIL-12, in the presence or absence of CD8-, CD4-, or NK1.1-depleted antibodies (200 μg i.p. twice weekly for 3 weeks each), and both the treated (right sided) tumor and the untreated (left sided) tumors were followed for growth. Significance determined by 2-way ANOVA.

