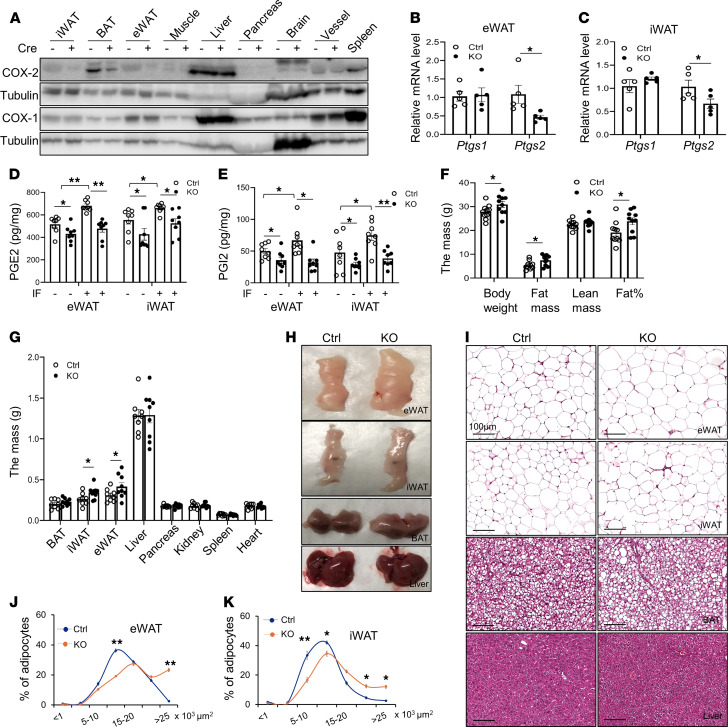
Figure 2. Adipocyte-specific depletion of COX-2 suppressed IF-induced PG production and increased adipocyte development.
(A–E) Three-month-old male COX-2–KO and control (Ctrl) mice were used. (A) COX-2 was highly enriched in AT compared with other tissue or organs, and adipocyte-specific depletion of COX-2 markedly downregulated COX-2 but not COX-1 protein levels in eWAT, iWAT, and BAT, with little effect on muscle, liver, pancreas, brain, or blood vessels. (B and C) The mRNA levels of Ptgs2 but not Ptgs1 were notably decreased by COX-2 depletion in eWAT and iWAT. The basal and IF secretion levels of PGE2 (D) and PGI2 (E) in eWAT and iWAT were significantly decreased in COX-2–KO mice compared with Ctrls. The tissue samples of eWAT and iWAT were minced and incubated in medium for 8 hours. The medium was collected and the levels of PGE2 and PGI2 were determined by an ELISA kit accordingly. (F–K) Six-month-old male COX-2–KO and Ctrl mice were used for these studies. (F) COX-2 deficiency promoted adipocyte development. The lean mass, fat mass, total mass, and fat percentage were measured using dual-energy X-ray absorptiometry scanning. (G) The mass of epididymal and inguinal fat pads, but not of brown fat, was increased in COX-2–KO mice. The organs were weighed after mice were euthanized. (H) Representative images of eWAT, iWAT, BAT, and liver in COX-2–KO and Ctrl mice. (I) H&E staining of eWAT, iWAT, BAT, and liver in COX-2–KO and Ctrl mice. (J and K) The fat cells’ size was enlarged by COX-2 deficiency in eWAT and iWAT. (B–G, J, and K) Data are presented as the mean ± SEM. (B, C, F, G, J, and K) Data were analyzed via t test. (D and E) ANOVA was used for statistical analysis. *P < 0.05; **P < 0.01.

