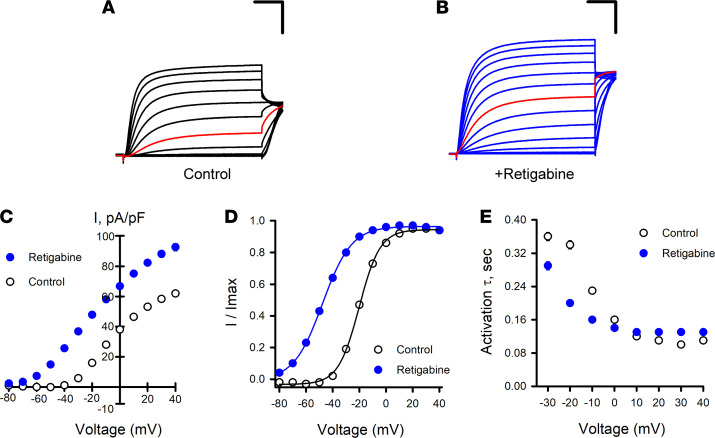
Figure 2. Effects of retigabine on KCNQ2/KCNQ3 channel activity.
(A) Averaged XE991-sensitive whole-cell currents normalized by membrane capacitance recorded from CHO-Q3 cells electroporated with KCNQ2-WT exposed to control or (B) exposed to 10 μM retigabine solutions. Red lines indicate currents recorded at –20 mV. (C) Average current-voltage relationships measured from CHO-Q3 cells electroporated with KCNQ2-WT exposed to control (open circles, n = 1086) or retigabine (filled blue circles, n = 1141) solutions. (D) Voltage-dependence of activation measured in control (open circles, black lines) or retigabine (filled blue circles, blue lines) solutions (control: V½ = –18.9 ± 0.2, k = 7.6 ± 0.1, n = 833; retigabine: V½ = –47.7 ± 0.3, k = 9.9 ± 0.1, n = 885). (E) Activation time constants measured in control (open circles, n =525–970) or retigabine (filled blue circles, n = 1036–1079) solutions. Scale bars: 200 ms (horizontal); 20 pA/pF (vertical). Data shown in C–E are mean ± SEM (error bars are smaller than some data symbols).

