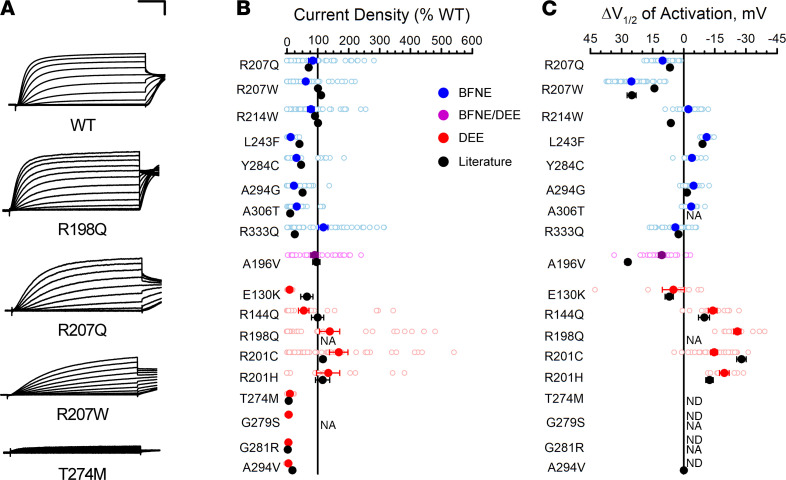
Figure 3. Functional properties of homozygous KCNQ2 variants determined by automated patch recording are comparable to those from previous voltage-clamp studies.
(A) Examples of averaged XE991-sensitive whole-cell currents recorded by automated patch clamp from CHO-Q3 cells electroporated with select KCNQ2 variants. Current values were normalized to WT channel peak current that was measured in parallel. Scale bars: 200 ms (horizontal); 25% (vertical). (B) Average peak whole-cell currents recorded at +40 mV from cells coexpressing KCNQ3 and KCNQ2 variants displayed as percent of WT channel that was measured in parallel. (C) Difference in activation V½ determined for cells coexpressing KCNQ3 and KCNQ2 variants relative to WT channel (horizontal scaling was designed to show loss-of-function in the leftward direction from zero). All experimental data are presented in B and C as open circles with filled circles representing mean values. Black symbols represent mean ± SEM voltage-clamp data from literature reported variants (error bars are smaller than data symbol in some cases), while automated patch clamp results are shown as blue for BFNE, red for DEE, or purple symbols for BFNE/DEE pathogenic variants. NA, not available; ND, cannot be determined.

