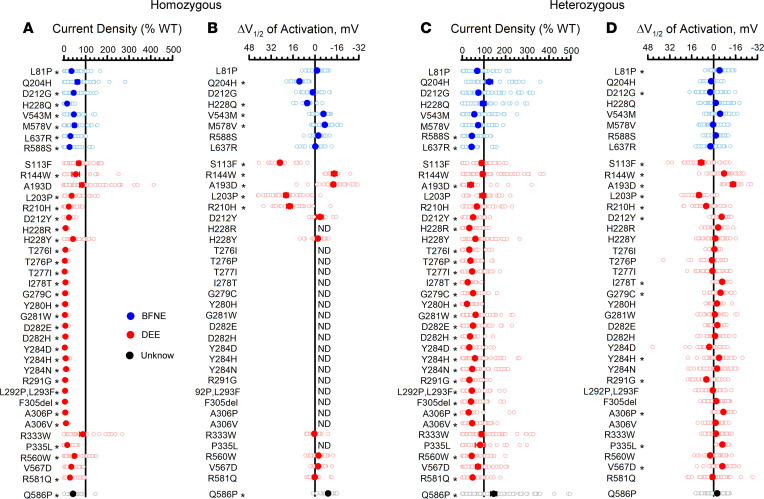
Figure 5. Functional properties of epilepsy-associated KCNQ2 variants.
(A) Average whole-cell currents recorded at +40 mV from CHO-Q3 cells electroporated with epilepsy-associated KCNQ2 variants expressed in the homozygous state displayed as percent of the WT channel measured in parallel (n = 16–75). (B) Differences in activation V½ determined for disease-associated variant channels expressed in the homozygous state and quantified relative to the WT channel measured in parallel (n = 7–41). (C) Average whole-cell currents recorded at +40 mV for epilepsy-associated KCNQ2 variants expressed in the heterozygous state quantified relative to the WT channel measured in parallel (n = 19–84). (D) Differences in activation V½ determined for epilepsy-associated KCNQ2 variants expressed in the heterozygous state relative to the WT channel measured in parallel (n = 13–69). All experimental data are presented as open circles with larger filled circles representing mean values. Blue symbols indicate variants associated with BFNE, red symbols are variants associated with DEE, and the black symbols represent a variant with an unclear phenotype. ND, cannot be determined. Statistical significance was determined using 1-way ANOVA. *P ≤ 0.01. Full data sets are provided in Supplemental Table 3 (homozygous) and Supplemental Table 4 (heterozygous).

