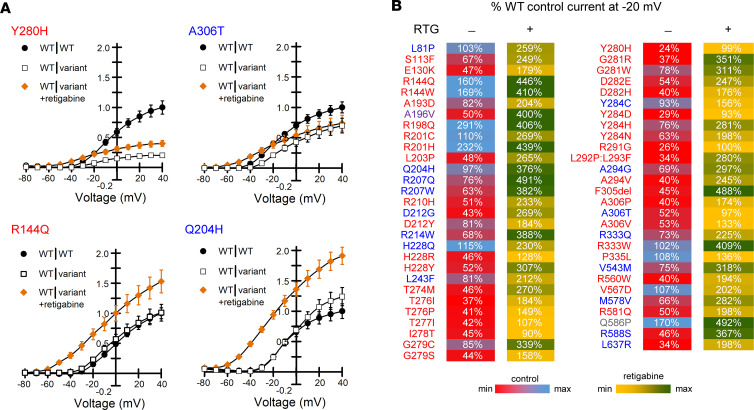
Figure 6. Responses of epilepsy-associated KCNQ2 variants to retigabine.
(A) Representative current-voltage relationships comparing WT (WT|WT, filled circles) and heterozygous variant (WT|variant, open squares) channel function in the absence of retigabine with heterozygous variant function measured in the presence of 10 μM retigabine (WT|variant +retigabine, orange filled diamonds). Current amplitude was first normalized to cell capacitance, then normalized to the WT current density measured at +40 mV. Variant labels are color coded by phenotype (blue, BFNE; red, DEE; purple, BFNE/DEE; gray, unclear phenotype). Data shown are mean ± SEM (error bars are smaller than some data symbols). (B) Heat map summarizing retigabine response data. Control values are current density measured at –20 mV for heterozygous variants in the absence of retigabine expressed as a percentage of untreated WT channel current density (Supplemental Table 5). Retigabine values are current density measured at –20 mV for heterozygous variants in the presence of 10 μM retigabine and expressed as a percentage of untreated WT channel current density (Supplemental Table 6). Each value is colored based on the scale shown.

