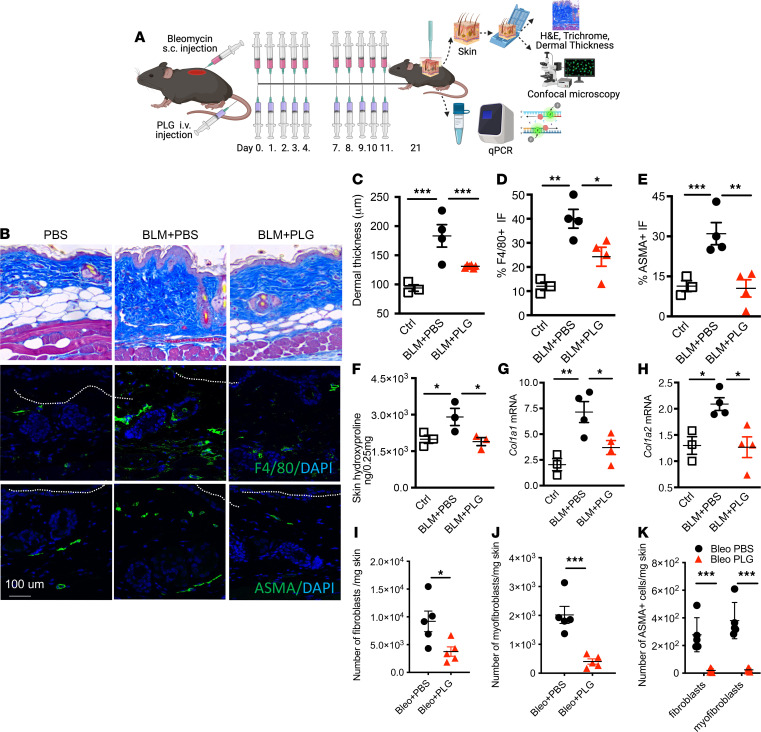
Figure 3. Prophylactic PLG nanoparticle treatment attenuates dermal fibrosis.
(A) Schematics of experimental design. (B) Representative micrographs of Masson’s trichrome stain (top); immunofluorescence (IF) staining for F4/80 (green) with DAPI staining of nuclei (middle); and α-SMA (green) (bottom). (C) Dermal thickness (mean ± SEM of 5 determinations per high-powered field (hpf) from 5 mice per group). (D and E) Dot plots of frequency of F4/80+ (D) and α-SMA+ (E) cell populations determined from 5 hpfs in each section. (F) Skin hydroxyproline content. (G and H) Real-time quantitative PCR (qPCR) of Col1a1 and Col1a2. Results, normalized with GAPDH, are reported as mean ± SEM of triplicate determinations from 3 to 4 mice per group. Total number of (I) fibroblasts, (J) myofibroblasts, (K) α-SMA+ fibroblasts and α-SMA+ myofibroblasts per milligram of skin per mouse (n = 4–5 with 3 independent experiments) measured by flow cytometry. *P < 0.05; **P < 0.01; ***P < 0.001 via 1-way ANOVA followed by the Šidák’s multiple comparison test. Ctrl, control.

