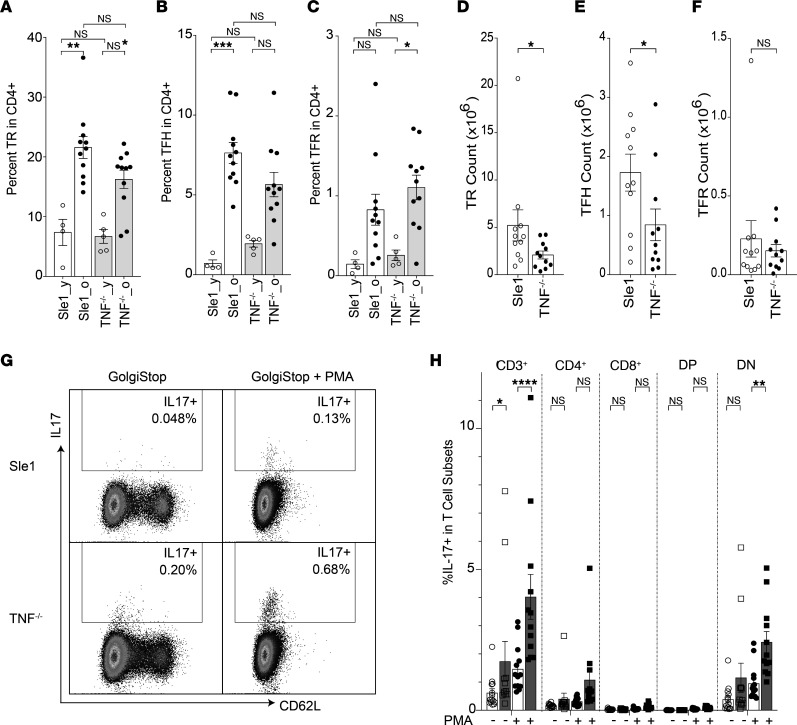
Figure 2. Inflammatory effector T cells are enhanced in TNF-deficient mice.
(A–C) Bar graphs show the percentage of Tregs (TR — CD3+CD4+Foxp3+) (A), TFH cells (CD3+CD4+PSGL1–CD44+PD1hiBcl6hi) (B), and TFR cells (CD3+CD4+PSGL1–CD44+PD1hiBcl6hiFoxp3+) (C) in CD4+ T cells of Sle1 and Sle1 TNF–/– mice (y, young, 2–3 months old; o, old, >8 months old). ANOVA Kruskal-Wallis with Dunn’s multiple comparisons test, *P < 0.05: **P < 0.01, ***P < 0.001. (D–F) Summary results of TR, TFH, and TFR cell counts in old mice, Mann-Whitney nonparametric test, *P < 0.05. (G) Plots show IL-17 expression in CD4+ T cells with (+)/without (-) PMA stimulation from Sle1 and Sle1 TNF–/– mice. (H) Summary bar plot shows the percentage of IL-17+ T cells in total CD3+ and indicated T cell subsets with/without PMA stimulation. Sle1 mice are shown in unfilled symbols, and Sle1 TNF–/– mice are shown in filled symbols. Ordinary 2-way ANOVA with Tukey’s multiple comparisons test, *P < 0.05: **P < 0.01, ****P < 0.0001. DP, CD4+CD8+; DN, CD4–CD8–.

