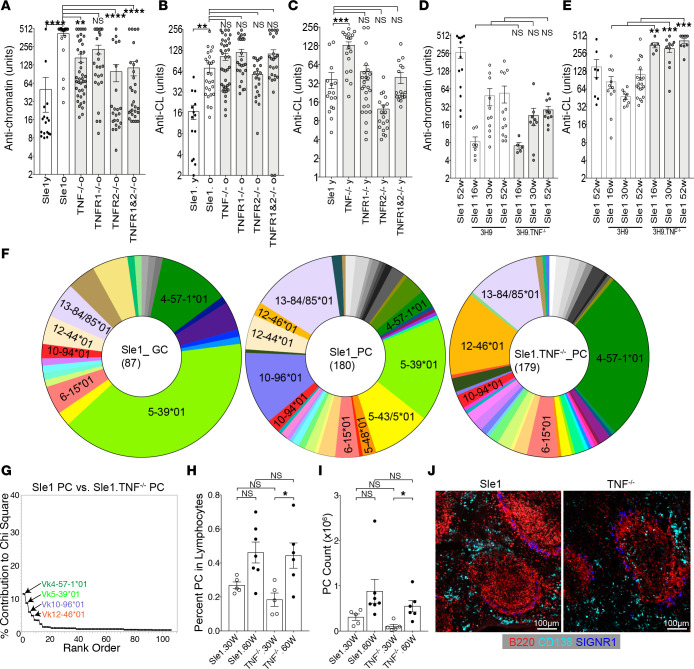
Figure 3. Altered autoantibody specificity in Sle1 TNF–/– and Sle1 TNFR1–/– mice.
(A and B) Bar graphs show the relative units of IgG antibodies against chromatin (A) and CL/β2GP1 (B) from sera of >9-month-old Sle1 mice of the indicated genotypes. (C) Bar graphs show the relative units of IgG antibodies against CL/β2GP1 from sera of 2- to 3-month-old Sle1 mice of the indicated genotypes. (D and E) Bar graphs show IgG antibodies against chromatin (D) and CL (E) from sera of 3H9 Sle1 and 3H9 Sle1 TNF–/– mice at sequential ages. (F) Pie charts show percentage of Igk light chain V region (Vk) gene usage in 3H9+ GC cells and plasma cells (PCs) from >9-month-old 3H9 Sle1 and PCs from 3H9 Sle1 TNF–/– mice. Fisher’s exact test rows × columns table, P < 0.0005. (G) Scree plot shows the percentage contribution to the χ2 analysis of the most overrepresented Vk genes in PCs of 3H9 Sle1 and 3H9 Sle1 TNF–/– mice. (H and I) Percentage (H) and number (I) of 3H9+ PCs from Sle1 and Sle1 TNF–/– mice at sequential ages. (J) Spleen CD138+ PCs are present in the extrafollicular region in >9-month-old Sle1 and Sle1 TNF–/– mice, representative of 3–5 mice per group. Dots on bar graphs represent individual mice. ANOVA Kruskal-Wallis with Dunn’s multiple comparisons test, *P < 0.05: **P < 0.01, ***P < 0.001, ****P < 0.0001. y, young (2–3 months); o, old (>9 months); w, weeks.

