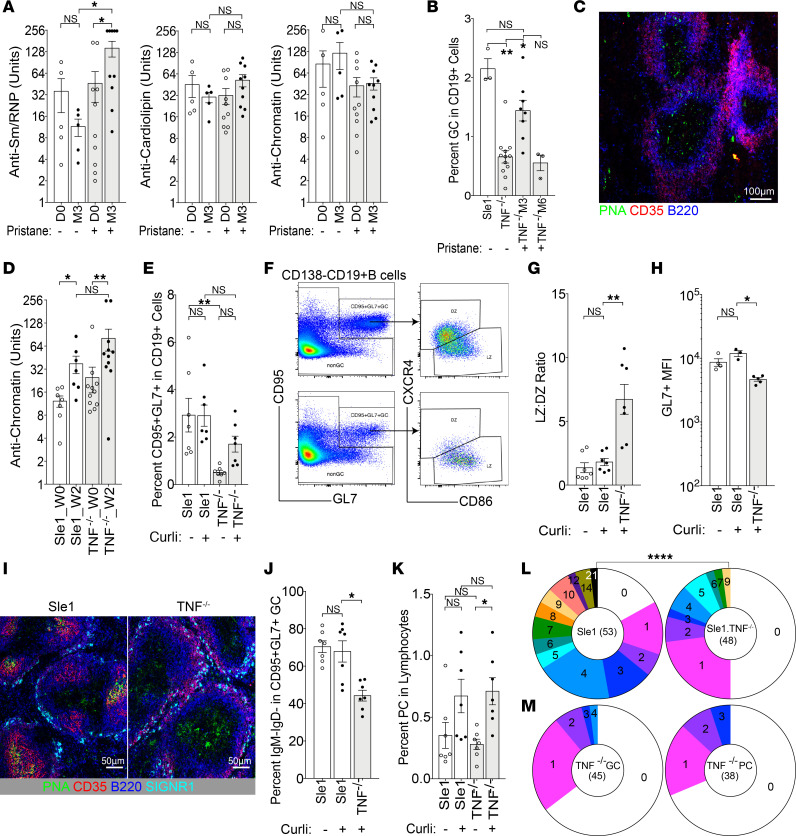
Figure 5. Innate stimulus induces activated GL7+ B cells and lupus-associated autoantibody production in Sle1 TNF–/– mice.
(A) Bar graphs show the relative units of IgG antibodies against Sm/RNP, CL, and chromatin (left to right) from sera of 12-week-old mice at day 0 (D0) and 3 months after (M3) pristane treatment. (B) Plot shows percentage of CD95+GL7+ cells in CD19+ B cells from pristane-treated mice. (C) Scattered PNA+ non–B cells are present in the T cell zone in Sle1 TNF–/– mice, 3 months after pristane treatment (original magnification, 10×). (D) Plot shows the relative units of IgG antibodies against chromatin in curli-treated mice. (E) Percentage of CD95+GL7+ cells from curli-treated mice. (F) Flow plots show the gating of splenic CD95+GL7+ B cells and their respective light zone (LZ) and dark zone (DZ) phenotype from Sle1 (top) and Sle1 TNF–/– mice (bottom). (G and H) Bar graphs show the summary result of LZ/DZ ratio (G) and GL7 expression (H). (I) PNA+ B cells are present in GCs in Sle1 mice and in the T cell zone of Sle1 TNF–/– mice, 6 weeks after curli treatment (original magnification, 20×). (J and K) Bar graph shows the percentage of IgM–IgD– cells in CD95+GL7+ B cells (J) and percentage of IgD–CD138+ PCs in total live lymphocytes (K). (L) Pie charts show percentage of VH sequences with mutations from single CD95+GL7+ B cells in curli-treated Sle1 (left) and Sle1 TNF–/– (right) mice. Each slice represents the proportion of cells with the indicated number of mutations. χ2 analysis, ****P < 0.0001. Dots on bar graphs represent individual mice. (M) Pie charts show percentage of IGKV4-57-1*01 sequences with mutations from single CD95+GL7+ GCs (left) and CD138+ PCs (right) B cells in curli-treated 3H9 Sle1 TNF–/– mice. Each slice represents the proportion of cells with the indicated number of mutations. (A, B, D, E, G, H, J, and K) ANOVA Kruskal-Wallis with Dunn’s multiple comparisons test, *P < 0.05, **P < 0.01. Dots on bar graphs represent individual mice. Immunohistochemistry represents 3–5 mice per group.

