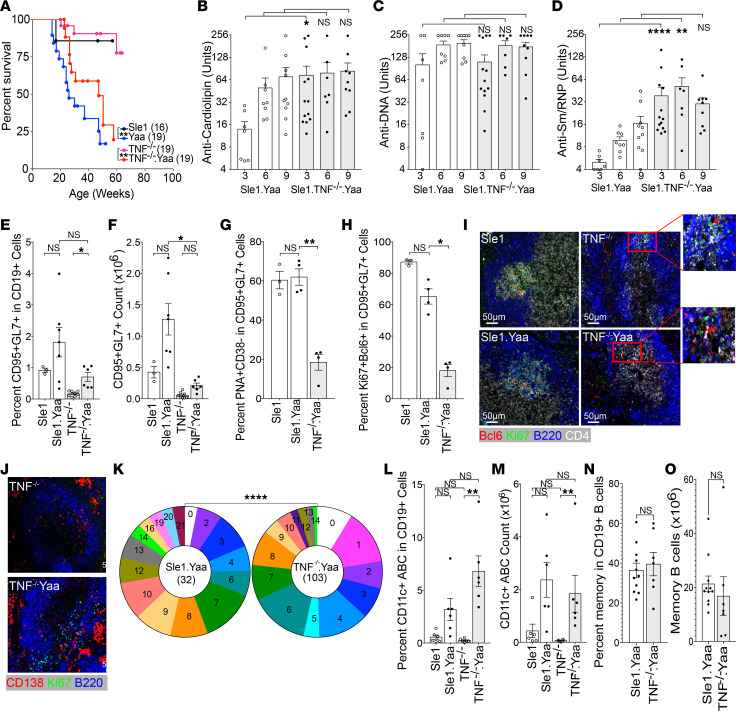
Figure 6. TLR7 overexpression induces pathogenic autoantibodies in Sle1 TNF–/– mice.
(A) Survival plots of male Sle1 mice of the indicated genotypes. Log-rank test **P < 0.01. (B–D) Plots show relative units of IgG antibodies against cardiolipin (B), DNA (C), and Sm/RNP (D) from sera of male Sle1 mice of the indicated genotype at 3, 6, and 9 months of age. (E–H) Summary bar graphs of flow cytometry analysis. (E and F) Percentage and count of CD95+GL7+ cells in CD19+ B cells from male Sle1, Sle1 Yaa, Sle1 TNF–/–, and Sle1 Yaa TNF–/– mice. (G and H) Percentage of PNA+CD38– (G) and Ki67+Bcl6+ (H) cells in splenic CD95+GL7+ B cells. (I) Immunohistochemistry images (original magnification, 20×) show Ki67+Bcl6+ B cells in GCs of male Sle1 (top left) and Sle1 Yaa (bottom left) mice. Ki67+Bcl6+ B cells are located at the T-B border in the T cell zone of male Sle1 TNF–/– (top right) and Sle1 Yaa TNF–/– (bottom right) mice (representative of 3–4 mice per group). (J) Ki67+ cells are located in GCs in Sle1 Yaa mice and at the T-B border and in the bridging zones adjacent to extrafollicular foci in Sle1 Yaa TNF–/– mice. (K) Pie charts show mutation frequencies in VH sequences from CD138+ PCs from Sle1 Yaa (left) and Sle1 Yaa TNF–/– (right) mice. χ2, ****P < 0.0001. (L and M) Percentage and count of CD19+CD11c+ age-associated B cells (ABC) in male Sle1, Sle1 Yaa, Sle1 TNF–/–, and Sle1 Yaa TNF–/– mice. (N and O) Percentage and number of CCR6+CD38+ memory B cells in Sle1 Yaa and Sle1 Yaa TNF–/– mice. Dots on bar graphs represent individual mice. Immunohistochemistry representative of 3–5 mice per group. (B–H, L, and M) ANOVA Kruskal-Wallis with Dunn’s multiple comparisons test, *P < 0.05: **P < 0.01, ***P < 0.001. (N and O) Mann-Whitney nonparametric test.

