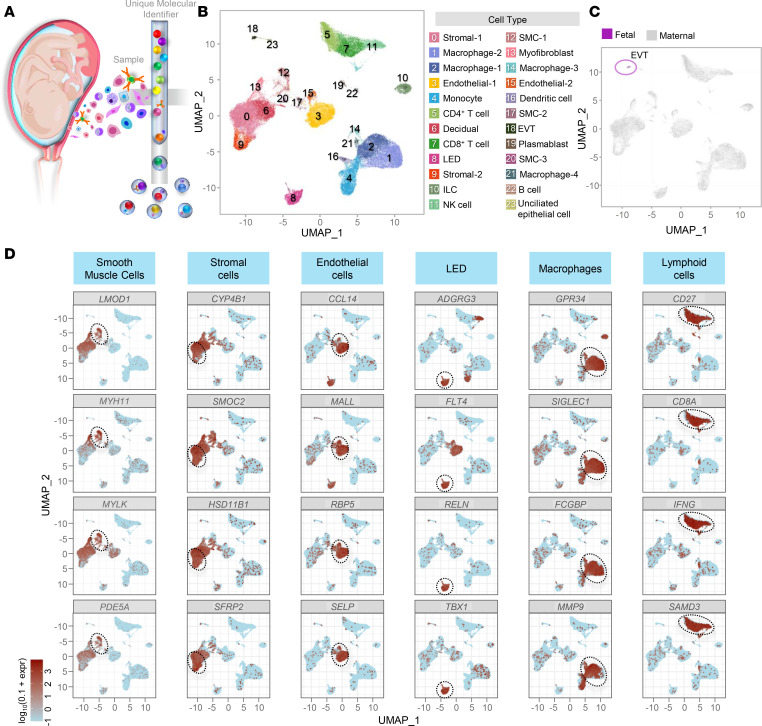
Figure 1. Single-cell transcriptional profile of the human myometrium.
(A) Diagram illustrating the isolation of single cells from myometrial tissues at term (n = 24) and the formation of Gel Bead-in-Emulsion (GEM) as part of 10x Genomics scRNA-Seq. (B) Uniform manifold approximation and projection (UMAP) plot showing the cell types found in myometrial tissues. EVT, extravillous trophoblast; ILC, innate lymphoid cell; LED, lymphoid endothelial decidual cell; NK cell, natural killer cell; SMC, smooth muscle cell. (C) UMAP plot of the myometrial cell population color-coded to show maternal (gray) and fetal (violet) origin. (D) UMAP visualizations showing the expression of selected marker genes for major cell clusters, where expression is indicated by the colored bar. Major cell clusters are enclosed by a dotted line.

