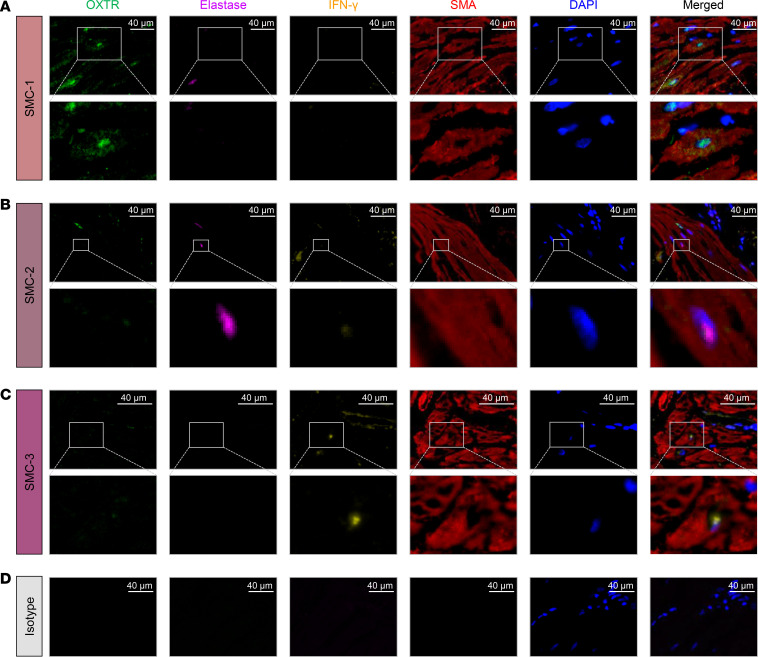
Figure 3. Spatial identification of SMC subpopulations.
(A–C) Representative images showing the protein expression of OXTR (oxytocin receptor, green), elastase (purple), IFN-γ (orange), and smooth muscle actin (SMA, red) in myometrial tissues from women who delivered at term in labor (n = 2) to identify (A) SMC-1, (B) SMC-2, and (C) SMC-3 subpopulations. Nuclear staining is shown in blue (4′,6-diamidino-2-phenylindole, DAPI). Merged images showing the coexpression of different markers are also included. Images were scanned at 40× original magnification (scale bar = 40 μm; top panel) with digital zoom (A and C, original magnification, 3×–5×; and B, original magnification, 10×) (bottom panel). (D) Representative images of a slide stained with isotype (negative control). Images were scanned at 40× original magnification (scale bar = 40 μm).

