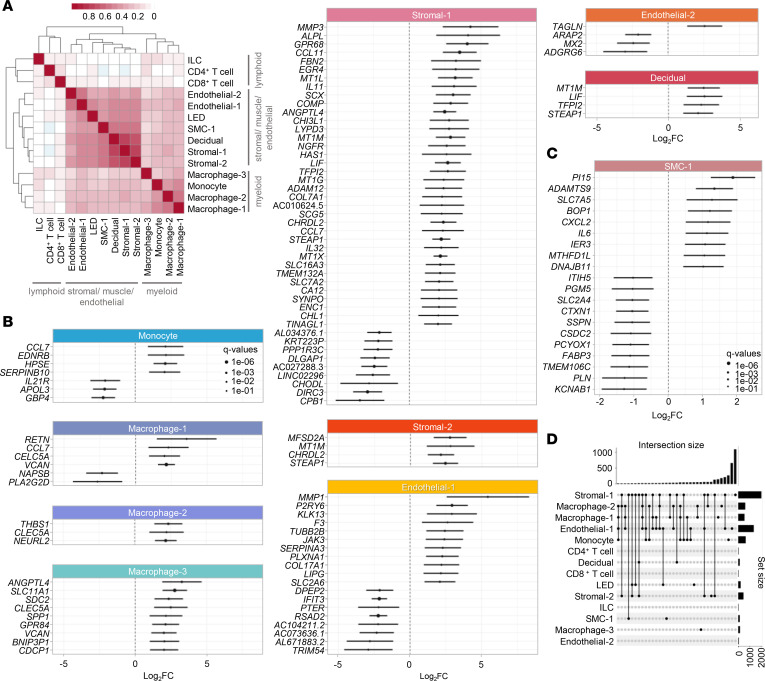
Figure 5. The effect of labor on the transcriptional activity of myometrial cell types.
(A) Heatmap showing the log2(fold change) correlation among cell types from myometrial tissues (n = 24), where red and white blocks signify increased and decreased correlation, respectively. A 2-sided Spearman’s correlation test was used. (B) Forest plots showing upregulated and downregulated labor-associated differentially expressed genes (DEGs) in Monocyte, Macrophage-1, Macrophage-2, Macrophage-3, Stromal-1, Stromal-2, Endothelial-1, Endothelial-2, and Decidual cell types. DEGs shown are significant with FDR < 0.05 and absolute log2(fold change) ≥ 2. (C) Forest plot showing upregulated and downregulated labor-associated DEGs in SMC-1, which are significant with FDR < 0.05 and absolute log2(Fold change) ≥ 1. DEGs were identified based on the 2-sided Wald’s test on the negative binomial distribution (DESeq2). (D) UpSet plot showing intersections between selected cell types based on common labor-associated DEGs, where connected black dots represent overlapping cell types and vertical bars in intersection set show degree of overlap. DEGs were selected based on q < 0.1. ILC, innate lymphoid cell; LED, lymphoid endothelial decidual cell; SMC, smooth muscle cell.

