. 2022 Mar 29;2022:7865015. doi: 10.1155/2022/7865015

Table 5.

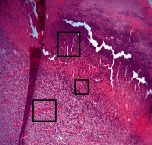
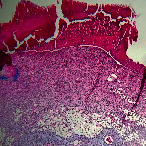
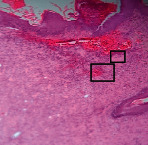
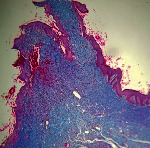
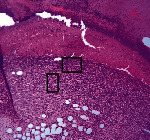
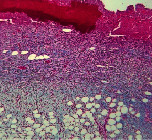
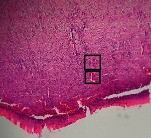
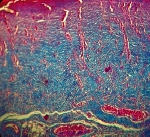
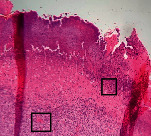
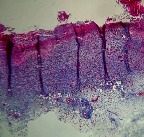
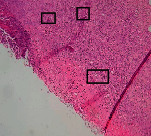
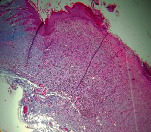
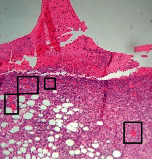
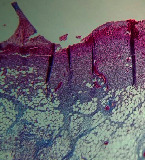
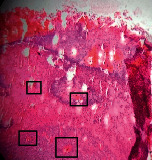
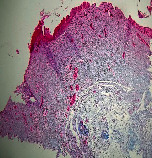
Microscopic images (40×) of different treatment groups tissue samples after being stained with H&E and MT on days 7 and 14 after treatment (blue zone indicates the fibroblast proliferation). Squares represent morphology changes such as edema, congestion, inflammation, necrosis, and angiogenesis during experimental period.

Groups Day 7 Day 14
H&E MT H&E MT
Vaseline graphic file with name APS2022-7865015.tab5.i001.jpg graphic file with name APS2022-7865015.tab5.i002.jpg graphic file with name APS2022-7865015.tab5.i003.jpg graphic file with name APS2022-7865015.tab5.i004.jpg
RFF graphic file with name APS2022-7865015.tab5.i005.jpg graphic file with name APS2022-7865015.tab5.i006.jpg graphic file with name APS2022-7865015.tab5.i007.jpg graphic file with name APS2022-7865015.tab5.i008.jpg
Silver graphic file with name APS2022-7865015.tab5.i009.jpg graphic file with name APS2022-7865015.tab5.i010.jpg graphic file with name APS2022-7865015.tab5.i011.jpg graphic file with name APS2022-7865015.tab5.i012.jpg
Free graphic file with name APS2022-7865015.tab5.i013.jpg graphic file with name APS2022-7865015.tab5.i014.jpg graphic file with name APS2022-7865015.tab5.i015.jpg graphic file with name APS2022-7865015.tab5.i016.jpg