Figure 1.

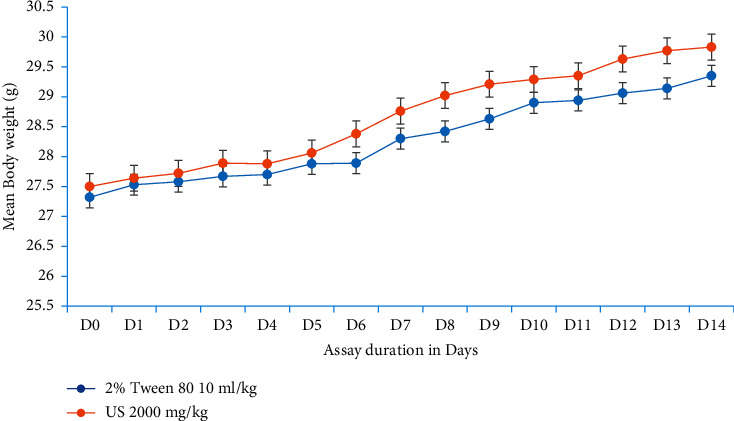
Evolution of mouse bodyweight over the course of an experiment. Data are expressed as mean ± SEM (n = 6). D, days; US, Urtica simensis.

Evolution of mouse bodyweight over the course of an experiment. Data are expressed as mean ± SEM (n = 6). D, days; US, Urtica simensis.