Figure 12.

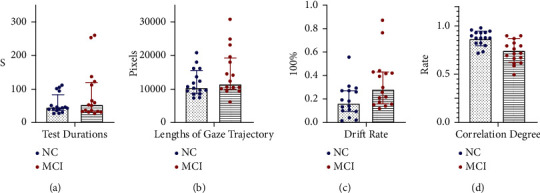
Comparison of indexes between MCI and NC. (a) Distribution of test durations. (b) Distribution of lengths of gaze trajectory. (c) Distribution of drift rate. (d) Distribution of correlation degree.

Comparison of indexes between MCI and NC. (a) Distribution of test durations. (b) Distribution of lengths of gaze trajectory. (c) Distribution of drift rate. (d) Distribution of correlation degree.